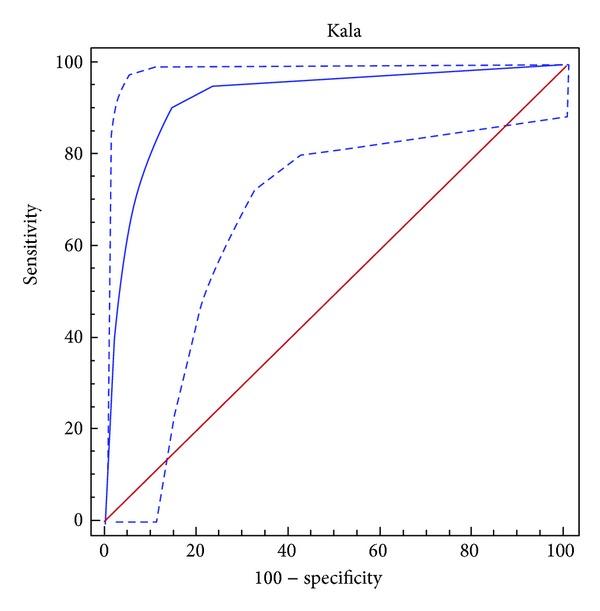
Figure 1.

ROC curve for the immunochromatographic assay for detection of anti-Leishmania IgG antibodies. Y-axis shows the false positive rate (specificity), and the x-axis shows the true positive rate (sensitivity). A test with the perfect discrimination has a ROC curve that passes through the upper left corner. The area under the curve (AUC) is W = 0.957 (P > 0.0001). The ROC analysis shows that the cutoff point for the test with the best sensitivity/specificity is >0 (Se: 92.1%; Sp: 97.14% expressed as percentages).
