
Figure 5.
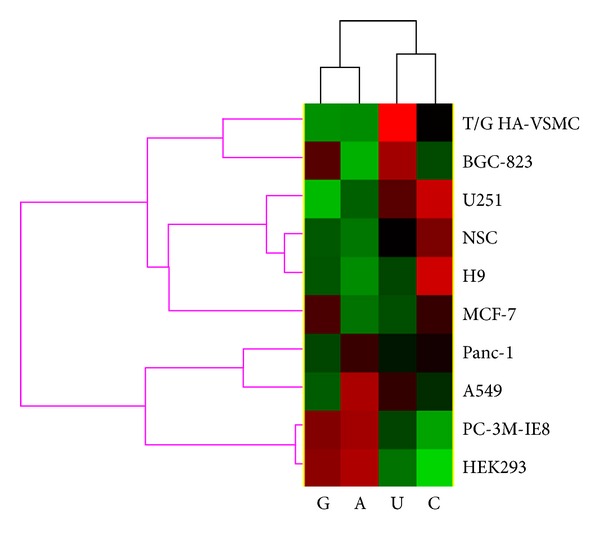
Correlation of miRNA stability (miRNA stability index, MSI) and nucleotide content (A, C, G, and U). Biclustering of the correlation coefficient was performed using Cluster software. The red color means a positive correlation, and the green color means a negative correlation.