
Figure 6. Expression of GAPDH in CD4 T Cells Determines IFN-γ Production after Listeria monocytogenes Infection In Vivo.
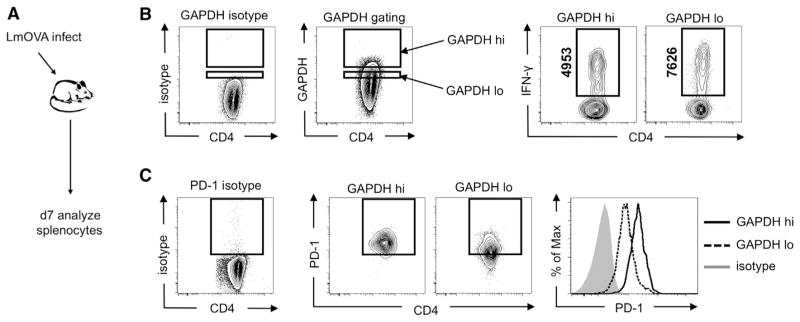
(A–C) A schematic is depicted (A) showing that mice were infected with L. monocytogenes, and splenocytes were analyzed 7 days later for GAPDH (B) and (C) and IFN-γ (B) and PD-1 (C) expression. Gating for high (GAPDH hi) and low (GAPDH lo) levels of GAPDH expression among GAPDH-positive cells, or PD-1 expression, was determined according to isotype controls. The mean fluorescence intensity of IFN-γ+ events is shown vertically as indicated. Data (B) and (C) are representative of at least two independent experiments.