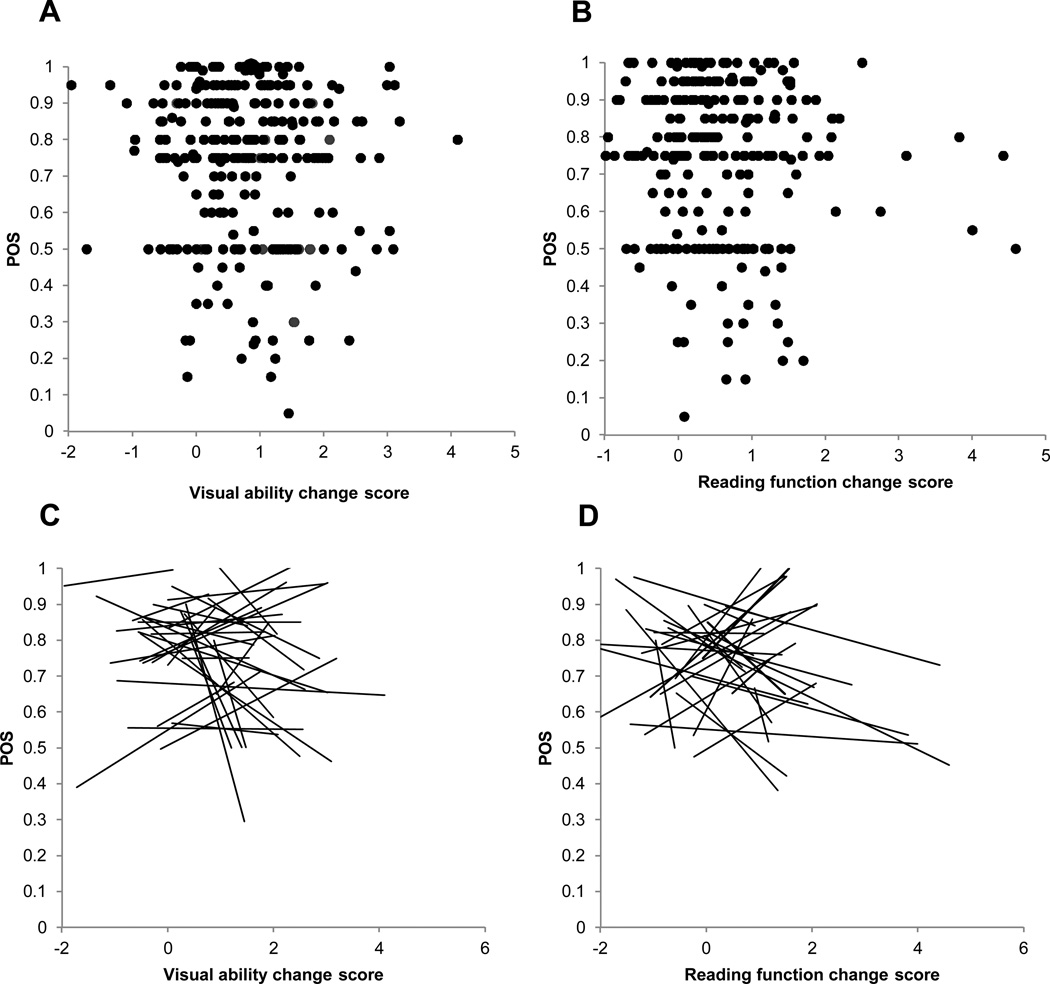
Figure 5.
(A) scatter plot of the clinician’s POS rating vs. the visual ability change score for each individual patient. (B) illustrates a scatter plot of the clinician’s POS rating vs. the reading function change score for all patients. (C) is a spaghetti plot of regression lines fit to POS vs. visual ability change score across patients for each clinician. (D) is a spaghetti plot of regression lines fit to POS vs reading function change score across patients for each clinician.

