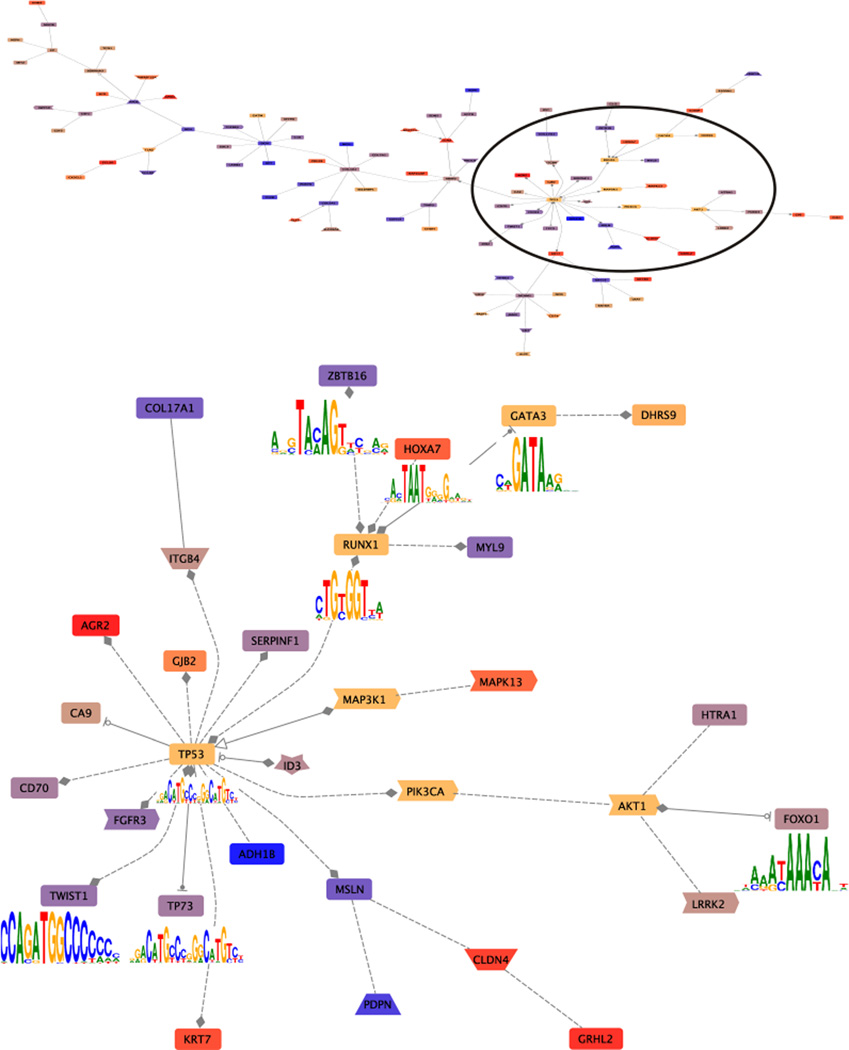
Figure 3.
Co-citation interaction networks among the DCIS genes observed in NGS analysis of DCIS models [43]. The co-citation networks among 295 differentially expressed genes and PIK3CA TP53 AKT1 GATA3 MAP3K1 CBFB and RUNX1 7 were constructed using GePS with default parameters (Genomatix). The gene connections are based on previous published literature, i.e., the co-citations between two genes in the previous published literature that have been hand-curated. This network indicates the co-citations of the input genes. The up-regulated genes are shaded in warm colors (red, orange). The down-regulated genes are shaded cooler colors (blue, purple). CBFB does not appear in the network. PIK3CA TP53 AKT1 GATA3 MAP3K1, and RUNX17 are shaded yellow-brown. Of these TP53, GATA3, and RUNX1 encode transcription factors with the motif indicated. The upper panel shows the entire network formed. The circle indicates the region expanded in the lower panel. Note the number of genes which share transcription factor binding sites as indicated by the filled line terminators: diamonds indicate that gene A modulates gene B; arrowheads indicate that gene A activates gene B, and stopped circles that gene A inhibits gene B. This overview provides the opportunity to selectively evaluate the veracity of the resulting pathway.

