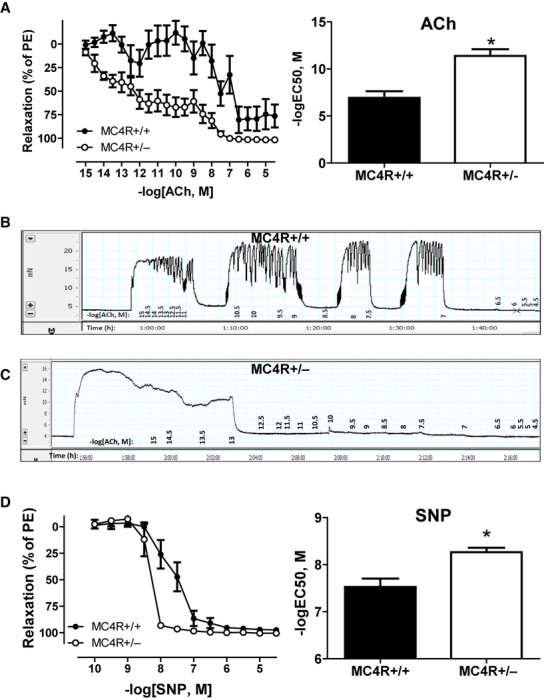
Figure 5.

Cumulative concentration–response curves (left) and logEC50 (right) to endothelial-dependent vasorelaxation to acetylcholine (ACh) (A) in third-order mesenteric arteries from lean MC4R+/+ and obese MC4R+/− pregnant rats at GD 19. Raw tracings to ACh in MC4R+/+ (B) and MC4R+/− (C). Cumulative concentration–response curves (left) and logEC50 (right) to the nitric oxide donor sodium nitroprusside (SNP) (D). *P < 0.05 versus MC4R+/+.
