Figure 6.

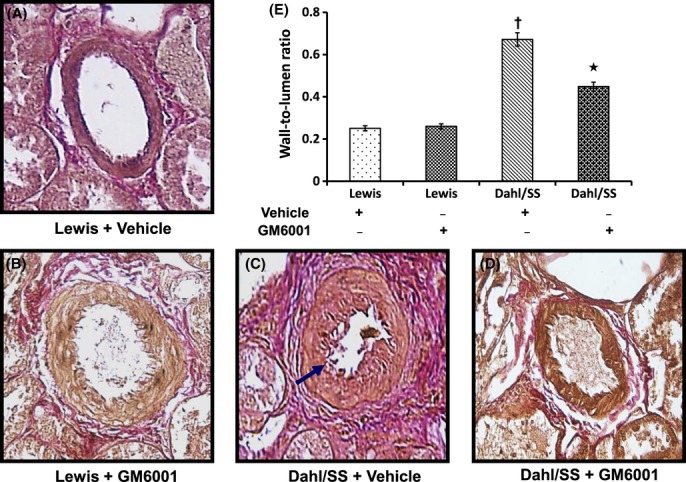
Elastin content in the tissue was measured in 5-μm-thick sections with Van Gieson's stain (A–D). Images A–D represent interlobular arteries in the renal cortex. Hypertensive Dahl/SS rats show increased wall thickness, elastin disruption, and narrowing of lumen diameter (blue arrow). Bar diagram (E) shows mean wall thickness–lumen diameter ratio ± SEM from five individual experiments. *P < 0.05 versus Dahl/SS + Vehicle; †P < 0.05 versus Lewis (Vehicle and GM6001). Image magnification ×60.
