Abstract
Polysilsesquioxane (PSQ) nanoparticles are crosslinked homopolymers formed by condensation of functionalized trialkoxysilanes, and provide an interesting platform for developing biologically and biomedically relevant nanomaterials. In this work, the design and synthesis of biodegradable PSQ particles with extremely high payloads of paramagnetic Gd(III) centers is explored, for use as efficient contrast agents for magnetic resonance imaging (MRI). Two new bis(trialkoxysilyl) derivatives of Gd(III) diethylenetriamine pentaacetate (Gd-DTPA) containing disulfide linkages are synthesized and used to form biodegradable Gd-PSQ particles by base-catalyzed condensation reactions in reverse microemulsions. The Gd-PSQ particles, PSQ-1 and PSQ-2, carry 53.8 wt% and 49.3 wt% of Gd-DTPA derivatives, respectively. In addition, the surface carboxy groups on the PSQ-2 particles can be modified with polyethylene glycol (PEG) and the anisamide (AA) ligand to enhance biocompatibility and cell uptake, respectively. The Gd-PSQ particles are readily degradable to release the constituent Gd(III) chelates in the presence of endogenous reducing agents such as cysteine and glutathione. The MR relaxivities of the Gd-PSQ particles are determined using a 3T MR scanner, with r1 values ranging from 5.9 to 17.8 mMs−1 on a per-Gd basis. Finally, the high sensitivity of the Gd-PSQ particles as T1-weighted MR contrast agents is demonstrated with in vitro MR imaging of human lung and pancreatic cancer cells. The enhanced efficiency of the anisamide-functionalized PSQ-2 particles as a contrast agent is corroborated by both confocal laser scanning microscopy imaging and ICP-MS analysis of Gd content in vitro.
1. Introduction
Nanoparticles are emerging as powerful contrast agents for medical imaging and biological diagnostics.[1] The outstanding properties of such nanoscale materials are attributed to the increased relative surface area, as well as the quantum confinement effect in some systems. In addition, these particulate materials can be functionalized to endow key properties for in vivo applications such as biocompatibility, long blood circulation time, target-specificity, and programmed clearance mechanisms. Such nanoprobes are beneficial to various imaging modalities, in particular, magnetic resonance imaging (MRI).
MRI is one of the most powerful noninvasive biomedical imaging technologies. However, MRI is also among the least sensitive imaging techniques and often requires the aid of contrast agents in order to produce adequate contrasts between normal and diseased tissues. Currently used MRI contrast agents are either macrocyclic gadolinium(III) chelates or simple manganese(II) molecules that lack sensitivity.[2] In addition, these small molecule contrast agents tend to have unfavorable pharmacokinetics. As a result, they are typically administered in high doses in order to achieve adequate contrasts. Nanoparticle-based MRI contrast agents can potentially overcome this limitation by providing more efficient signal enhancement as a result of the enhanced relaxivity on a per magnetic center basis as well as their ability to carry extremely large payloads of active magnetic centers. Moreover, these MRI nanoprobes can be further modified to improve biocompatibility, long blood circulation time, and target-specificity. Several platforms have been used to develop nanoparticle-based MRI contrast agents, including dendrimers, polymers, liposomes, and hybrid or inorganic nanoparticles.[3]
We and others have reported the development of mesoporous silica nanoparticle (MSN) based MRI contrast agents.[4] We have demonstrated that this platform has an extraordinary ability to enhance MR images both in vitro and in vivo.[4d,e,g] However, significant amounts of silica matrices are used to carry the Gd chelates in the MSN systems. Moreover, many of these nanoprobes cannot be quickly excreted after MRI examination, leading to potential tissue accumulation of toxic Gd(III) ions.[5] This slower clearance of Gd(III) chelates has been associated to a fatal condition known as nephrogenic systemic fibrosis (NSF).[6] For these reasons, it is imperative to develop new nanoparticulate platforms that not only carry high payloads of Gd chelates but also can be readily eliminated from the body after carrying out their diagnostic functions.
Polysilsesquioxane (PSQ) nanoparticles are crosslinked homopolymers formed by condensation of functionalized trialkoxysilanes or bis(trialkoxysilanes). PSQ materials have recently attracted a great deal of attention as a class of versatile functional hybrid particles with tunable size, morphology, and chemical properties.[7] We believe that PSQ particles provide an interesting platform for developing biologically and biomedically relevant nanomaterials. We recently demonstrated the design of PSQ nanoparticles containing a high loading of a chemotherapeutic agent (oxaliplatin) as an excellent delivery vehicle for cancer therapeutics.[8] PSQ particles not only retain most of the attractive features of silica-based materials for biomedical applications such as well-defined and tunable structures, surface chemistry, and biocompatibility but also offer additional advantages. For example, the PSQ platform is essentially carrier free, allowing much higher loadings of therapeutic and/or imaging agents than surface-functionalized silica-based materials. In addition, the physicochemical properties of PSQ nanoparticles can be more easily tuned by changing the monomer properties than in silica-based systems. We wish to take advantage of these attractive properties to formulate PSQ-based MRI contrast agents with high payloads of Gd chelates, programmed clearance mechanisms, and enhanced MR imaging properties. Herein, we report the synthesis and characterization of Gd-PSQ nanoparticles and their application as T1-weighted MR contrast agents (Scheme 1). These particles contain Gd(III) chelates covalently linked via a labile disulfide bond, which bestow redox-responsive degradable properties to this system. The Gd-PSQ nanoparticles were post-synthetically modified with polyethylene glycol (PEG) chains and the anisamide (AA) ligand to enhance biocompatibility and cell uptake, respectively. The effectiveness of the PSQ particles as efficient optical imaging and MRI contrast agents was successfully demonstrated using human lung (H460) and pancreatic (AsPC-1) cancer cells.
Scheme 1.

Synthesis of Gd-PSQ nanoparticles in reverse microemulsions. Two different Gd-chelates (1 and 2) were used to afford PSQ-1 and PSQ-2 particles with high r1 MR relaxivities. PSQ-2 was further functionalized with PEG or anisamide-PEG via the surface carboxy groups.
2. Results and Discussion
2.1. Synthesis and Characterization of Gd-PSQ Nanoparticles
Two new Gd(III) diethylenetriamine pentaacetate (Gd-DTPA) derivatives (Scheme 1) were used as the monomers for the synthesis of the Gd-PSQ MRI contrast agents. Gd(III) [bis(triethoxysilylpropyl cystamide) diethylenetriamine pentaacetic acid] (1), was synthesized in a multistep sequence (Scheme S1, SI). 2-(pyridin-2-yldisulfanyl)cysteamine (a) was first prepared by treating cysteamine and 2,2′-dipyridyl disulfide in a methanolic solution containing acetic acid, followed by treatment with one half equivalent of DTPA bisanhydride in anhydrous pyridine to afford bis-cystamide-diethylenetriamine pentaacetic acid (b). The corresponding Gd(III) complex c was formed by reacting one equivalent of GdCl3 with the deprotonated form of b. Finally, the desired Gd-chelate (1) was produced by reacting two equivalents of 3-mercaptopropyltriethoxysilane with c in dry methanol. Gd(III) [bis(triethoxysilylpropyl cysteinamido) diethylen-etriamine pentaacetic acid] (2) was synthesized in a similar fashion with cysteine hydrochloride in place of cysteamine hydrochloride in the reaction sequence (Scheme S1, SI). The disulfide linkages in both Gd complexes 1 and 2 can be rapidly reduced by endogenous reducing agents such as cysteine and glutathione to endow biodegradability to the resulting PSQ particles (see Section 2.3). In addition, the Gd complex 2 contains orthogonal carboxylic acid functionalities, which can be used to post-synthetically functionalize the resulting PSQ nanoparticles as described below.
PSQ particles based on 1 and 2 were synthesized by base-catalyzed condensation reactions in a quaternary and a ternary reverse microemulsion system, respectively. The resulting PSQ-1 and PSQ-2 nanoparticles were precipitated by the addition of ethanol, followed by repeated washes with ethanol. The particle sizes and morphologies were characterized by scanning electron microscopy (SEM) and dynamic light scattering (DLS). As shown in Figure 1a, SEM images of PSQ-1 showed aggregated nanoparticles of roughly 30 nm in diameter. However, DLS measurements on the same PSQ-1 gave a hydrodynamic diameter (Z-average) of 123 nm in a phosphate buffered saline solution (PBS, 1 mM) (polydispersity index, PDI = 0.15) (Figure 1b). The discrepancy between the SEM and DLS results is probably due to a combination of the slight aggregation of PSQ-1 in PBS and its hydrogel-like behavior.[7c] SEM images of PSQ-2 showed fairly spherical nanoparticles of 100–150 nm in diameter (Figure 2a). The DLS measurements of PSQ-2 gave a hydrodynamic diameter of 220 nm (PDI = 0.062) in PBS (Table 1 and Figure 2b). PSQ-1 and PSQ-2 exhibited negative surface charges (ζ potentials) of −15.0 and −22.4 mV, respectively, in PBS buffer. Thermogravimetric analysis (TGA) and inductively-coupled plasma mass spectrometry (ICP-MS) were used to determine the loadings of Gd chelates in the PSQ particles. PSQ-1 showed a 44.2 wt% weight loss for the organic component (Figure 1c). ICP-MS measurements of PSQ-1 gave a Gd loading of 14.3 wt%. PSQ-2 showed a 41.3 wt% organic weight loss by TGA and 15.7 wt% Gd by ICP-MS (Table 1 and Figure 2c). Interestingly, owing to the lack of carriers, Gd-PSQ particles have three times higher loadings of paramagnetic centers than those of mesoporous silica nanoparticles.[4e,g]
Figure 1.
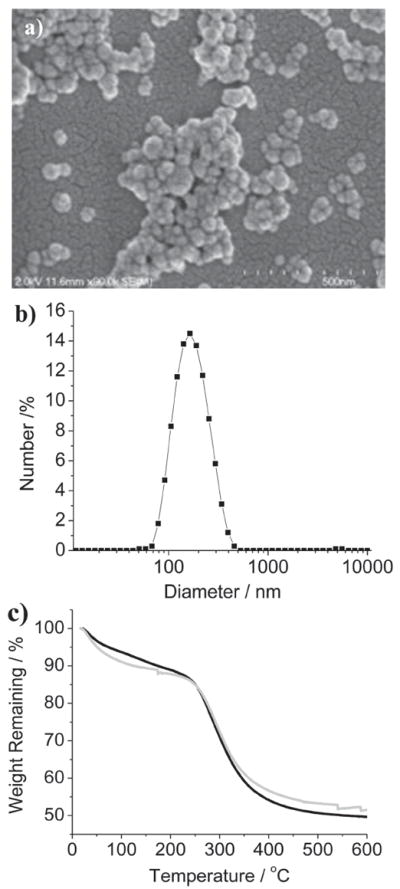
Characterization of PSQ nanoparticles. a) SEM image of PSQ-1; b) DLS plot of PSQ-1 in PBS; c) TGA profile for PSQ-1 (black), and PSQ-2 (gray).
Figure 2.
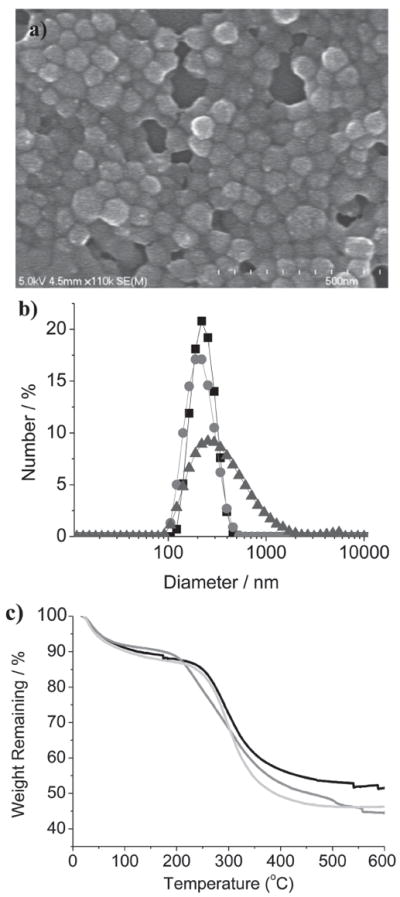
Characterization of PSQ nanoparticles. a) SEM image of PSQ-2; b) DLS plots of PSQ-2 (square), PEG-PSQ-2 (circle), and AA-PEG-PSQ-2 (triangle) in PBS; c) TGA profiles for PSQ-2 (black), PEG-PSQ-2 (gray), and AA-PEG-PSQ-2 (light gray).
Table 1.
Detailed characterization of Gd-PSQ nanoparticles.
| Material | Z-average [nm] a) | PDI a) | ζ-potential [mV] a) | Gd content [wt%] | PEG content [wt%] |
|---|---|---|---|---|---|
| PSQ-1 | 123.0 ± 2.6 | 0.15 ± 0.04 | −15.0 ±3.6 | 14.3 ± 1.4 | — |
| PSQ-2 | 219.5 ± 1.4 | 0.06 ± 0.02 | −22.4 ±2.2 | 15.7 ± 3.2 | — |
| PEG-PSQ-2 | 200.4 ± 3.6 | 0.09 ± 0.03 | −1.9 ±2.1 | 12.3 ± 4.5 | 6.3 |
| AA-PEG-PSQ-2 | 292.5 ± 3.8 | 0.25 ± 0.01 | −3.1 ±2.3 | 10.9 ± 5.8 | 7.4 |
Measured in PBS (1 mM, pH 7.4).
The surface carboxy groups on PSQ-2 allow their post-synthetic functionalization to increase biocompatibility and cell uptake. Polyethylene glycol (PEG) is the preferred method of increasing biocompatibility and imparting stealth properties to nanoparticles.[9] PSQ-2 particles were PEGylated through a coupling reaction between the carboxylic acid groups on the surface of the nanoparticles and an amino-functionalized PEG(5K) using 1-ethyl-3-(3-dimethylaminopropyl) carbodiimide (EDC) as a coupling agent to afford PEG-PSQ-2. SEM images did not show any appreciable change in the morphology or size of the PEG-PSQ-2 nanoparticles (see Figure S1, SI). The DLS measurements showed that PEG-PSQ-2 particles have a similar hydrodynamic diameter as that of PSQ-2 (Figure 2b and Table 1). However, the surface charge of the material measured by the ζ potential increased dramatically from −22.4 mV to −1.9 mV, indicating the presence of a PEG layer that shields the negative surface charge of PSQ-2. The existence of PEG was further confirmed by TGA; an increase in weight loss of 6.3% was observed after PEGylation (Figure 2 c and Table 1). In a similar way, the AA-terminated PEG was attached to the surface of PSQ-2 using a mixture of NH2-PEG and amino-functionalized AA-PEG (7:3 wt/wt) to afford AA-PEG-PSQ-2 particles. The AA moiety is an effective ligand for sigma receptors, which are overexpressed in a variety of human and rodent cancer cell lines.[10] After functionalization with AA-PEG, the nanoparticles exhibited an increase of 70 nm in their hydrodynamic diameter (Z-average = 292.5 nm) and a ζ potential of −3.1 mV (Figure 2 b and Table 1). TGA showed an increase of organic weight loss of 7.4%.
2.2. Determination of MR Relaxivities of Gd-PSQ Particles
The relaxivities for the Gd-PSQ particles were measured with a 3T MR scanner (Figure 3). On a per Gd basis, PSQ-1 and PSQ-2 have r1 values of 17.8 and 13.1 mM−1s−1, respectively, and r2 values of 19.5 and 28.6 mM−1s−1, respectively (Figure S2a,b, SI). The r1 relaxivities of the Gd-PSQ particles compare favorably to other nanoparticle-based MRI contrast agents and are superior to the small molecule contrast agent Magnevist, which has an r1 value of 4.9 Mm−1s−1 under similar conditions.[3f] The enhanced r1 relaxivities for nanoparticles can in part be attributed to their slower tumbling rates.[11] Interestingly, PSQ-1 nanoparticles can be successfully internalized by monocyte cells as shown in the T1- and T2-weighted MRI images of cell pellets (see Figure S3, SI).
Figure 3.
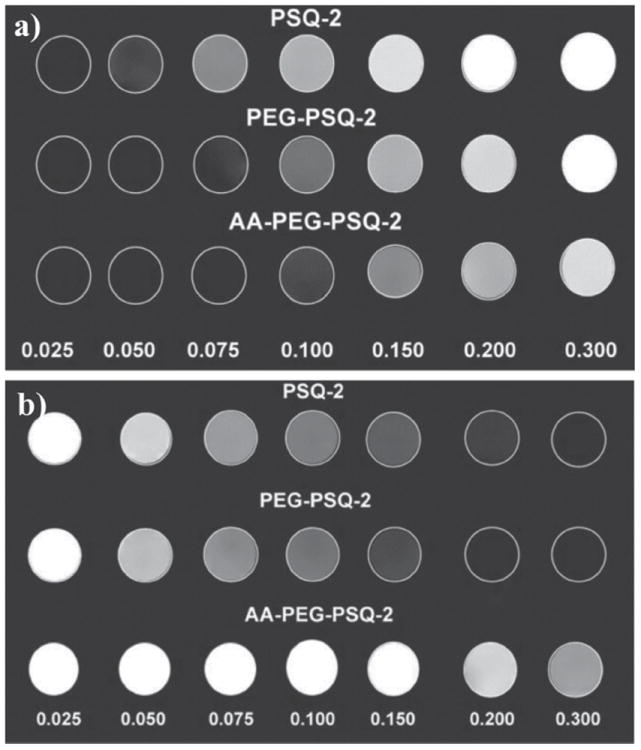
T1- (a) and T2-weighted (b) MR phantom images of PSQ-2, PEG-PSQ-2, and AA-PEG-PSQ-2 at various Gd concentrations.
The MR relaxivities of the PEG-PSQ-2 and AA-PEG-PSQ-2 nanoparticles were also determined on a 3T MR scanner. On a per Gd basis, the r1 values were 8.4 mM−1s−1 and 5.9 mM−1s−1 and the r2 values were 33.0 mM−1s−1 and 7.0 mM−1s−1 for PEG-PSQ-2 and AA-PEG-PSQ-2, respectively (Figure S2c,d, SI). The r1 relaxivity values for the modified PSQ particles decreased in comparison to that of PSQ-2, presumably due to the presence of PEG and AA-PEG chains that inhibit the interactions of the Gd centers with surrounding water molecules.[12]
2.3. Biodegradability of Gd-PSQ Particles under Reducing Environments
The Gd-PSQ particles should be stable under normal physiological conditions, but can readily degrade to release the Gd chelates as a result of the reductive cleavage of the disulfide bonds by endogenous biomolecules, such as glutathione and cysteine. The Gd chelate monomers could be cleared via the renal excretion pathway in vivo to reduce the potential toxicity of the Gd-PSQ particles.[4g,13] Release experiments revealed that both PSQ-1 and PSQ-2 particles are stable in the absence of reducing agents, with only 5% or less background release over a few hours (Figure 4). However, after the addition of 10 mM cysteine, Gd chelates were quickly released from the PSQ-1 and PSQ-2 particles with half-lives (t1/2) of 5 h and 12 h, respectively. In both particles, more than 90% of the Gd chelates were released after two days of incubation with cysteine. In the case of PSQ-2, the steric effect around the disulfide bonds significantly affected the particle degradation rate in the presence of reducing agents.[14] After PEGylation, the t1/2 of Gd chelate release further increased to 18 h, consistent with the additional steric hindrance from the PEG polymer (Figure 4). The ability to tune the degradation rates of Gd-PSQ particles via steric control over the disulfide bond should prove important for optimizing in vivo performance of this nanoparticulate MR contrast agent platform in the future.
Figure 4.
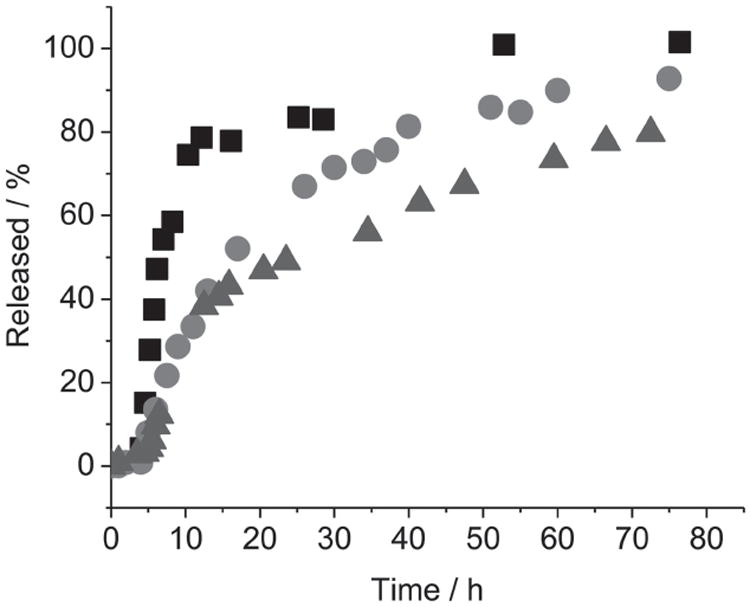
Release profiles of Gd chelates from PSQ-1 (squares), PSQ-2 (circles), and PEG-PSQ-2 (triangles) in the presence of 10 mM cysteine at 37 °C.
2.4. In Vitro Performance of Gd-PSQ Particles as Efficient MRI and Optical Imaging Contrast Agents
T1-weighted MR images of human lung H460 and pancreatic AsPC-1 cancer cells after incubation with PSQ-2 particles are shown in Figure 5. Significant positive signal enhancements were observed in the T1-weighted MR images of both H460 and AsPC-1 cell pellets incubated with all versions of PSQ-2 particles when compared to cell pellets that were not incubated with nanoparticles. Moreover, the T1-weighted images of the H460 and AsPC-1 cell pellets incubated with the AA-PEG-PSQ-2 particles showed much higher signal enhancements than those incubated with non-modified PSQ-2 particles. For each of the cell lines, the T1-weighted MR signal intensity appears to follow the increasing trend of no particle < PEG-PSQ-2 < PSQ-2 < AA-PEG-PSQ-2. This behavior was confirmed by quantitative ICP-MS measurements of the amounts of Gd ions internalized by cancer cells (Figure 6). The ICP-MS data also showed that the internalization of PEG-PSQ-2 particles was inhibited compared to PSQ-2 (Figure 6); however, the presence of the AA targeting group enhanced the amount of Gd internalized by the cancer cells. It has been shown that coating nanoparticles with PEG decreases the non-specific binding to the cell membrane, thus reducing the nonspecific accumulation in cells.[15] One the other hand, sigma receptors (e.g., sigma-2) are more highly expressed in cancer cells compared to normal cells, leading to enhanced cellular uptake of AA-PEG-PSQ-2.[10a,b]
Figure 5.
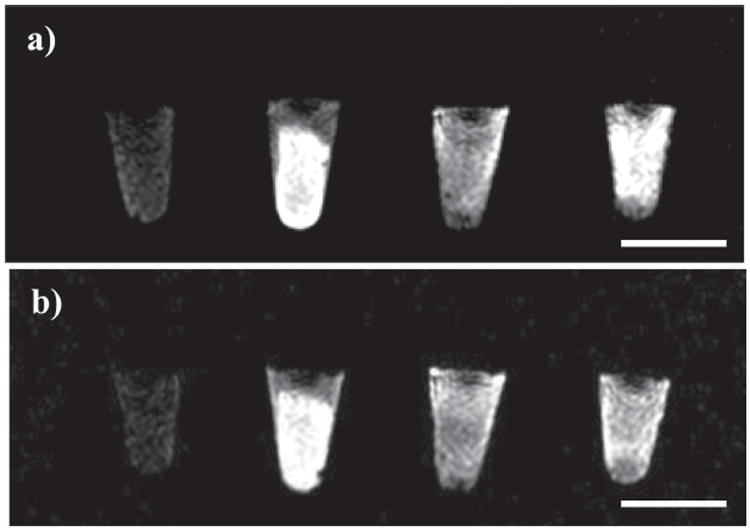
T1-weighted images of H460 and AsPC-1 cell pellets. a) The images from left to right correspond to H460 cells incubated with no particles, AA-PEG-PSQ-2 (100 μg/mL), PEG-PSQ-2 (100 μg/mL), and PSQ-2 (100 μg/mL). b) The images from left to right correspond to AsPC-1 cells incubated with no particles, AA-PEG-PSQ-2 (100 μg/mL), PEG-PSQ-2 (100 μg/mL), and PSQ-2 (100 μg/mL). Scale bar is 5 mm.
Figure 6.

Amount of Gd(III) ions internalized by H460 (left) and AsPC-1 (right) cells incubated with PSQ materials for 12 h with 100 μg mL−1.
The enhanced efficacy of AA-PEG-PSQ-2 particles as MRI contrast agents was further confirmed by confocal laser scanning microscopic (CLSM) imaging of H460 and AsPC-1 cells. The AA-PEG-PSQ-2, PEG-PSQ-2, and PSQ-2 nanoparticles were labeled with fluorescein isothiocyanate (FITC) to enable optical imaging of the particles (Figure 7 and Figure 8). As shown in the confocal micrographs, the AA-PEG-PSQ-2 nanoparticles (Figures 7c,8c) were internalized by both cancer cell lines in a higher magnitude than the non-targeted materials (Figures 7a,8a and 7b,8b). In addition, competitive binding assay experiments with the anisamide ligand confirmed the enhanced uptake of AA-PEG-PSQ-2. ICP-MS analyses indicated that pre-incubation of both H-460 and AsPC-1 cells with PEG-anisamide (1, 5, and 10 mM) significantly reduced the uptake of AA-PEG-PSQ-2 but not PEG-PSQ-2 when compared to those without pre-incubation with the anisamide ligand (Figure S4, SI). These results not only demonstrate the utility of the Gd-PSQ particles as efficient T1-weighted MRI contrast agents but also point to the potential of detecting cancer cells by MRI and optical imaging in a target-specific fashion via conjugation of targeting ligands to the surfaces of Gd-PSQ particles.
Figure 7.
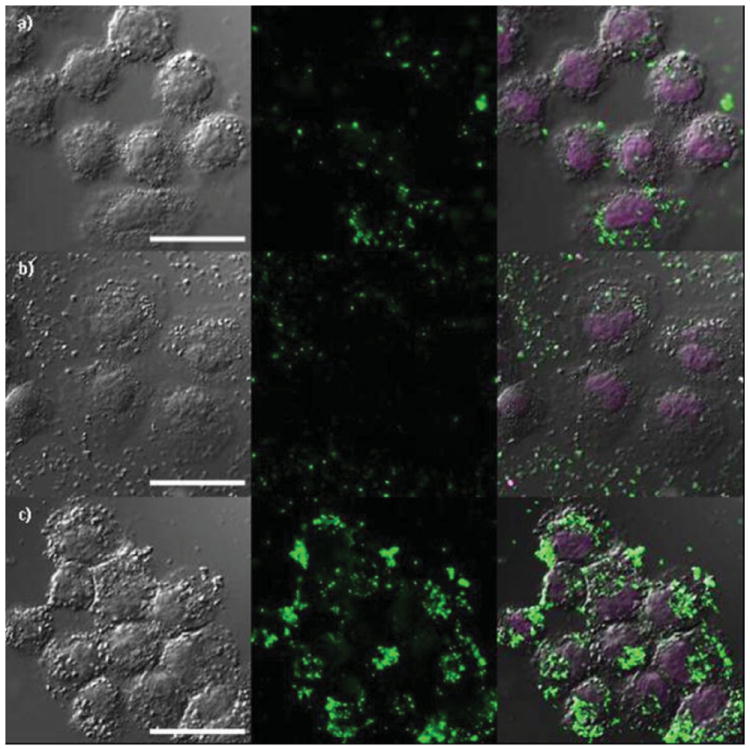
Confocal microscope images of H460 cancer cells incubated with a) FITC-labeled PSQ-2; b) FITC-labeled PEG-PSQ-2; and c) FITC-labeled AA-PEG-PSQ-2. The figures from left to right depict bright field images, green fluorescence of FITC-labeled PSQ materials, and merged images of bright field and green fluorescence with DRAQ5-stained nuclei, respectively. The cells were incubated in the presence of Gd-PSQ particles for 12 h at a concentration of 100 μg/mL. Scale bar is 20 μm.
Figure 8.
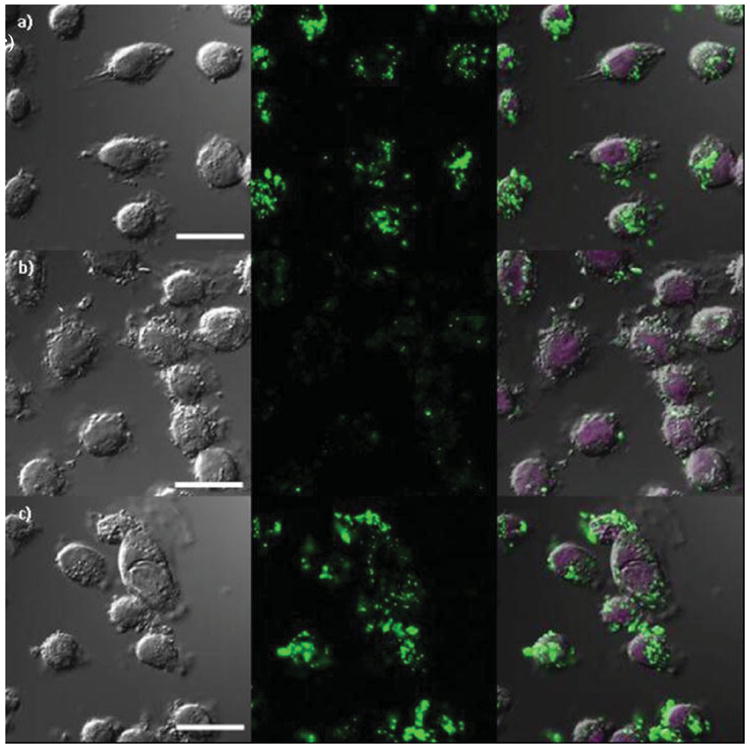
Confocal microscope images of AsPC-1 cancer cells incubated with a) FITC-labeled PSQ-2, b) FITC-labeled PEG-PSQ-2, and c) FITC-labeled AA-PEG-PSQ-2. The figures from left to right depict bright field images, green fluorescence of FITC-labeled PSQ materials, and merged images of bright field and green fluorescence with DRAQ5-stained nuclei, respectively. The cells were incubated in the presence of Gd-PSQ particles for 12 h at a concentration of 100 μg/mL. Scale bar is 20 μm.
3. Conclusion
We have synthesized and characterized Gd-PSQ nanoparticles with a high loading of magnetic centers and a strong ability to enhance MRI contrast. The Gd-PSQ particles were constructed from two different Gd-chelates containing redox-responsive disulfide bonds, and were biodegradable in the presence of an endogenous reducing agent. The Gd-PSQ particles were further functionalized with PEG and anisamide-PEG chains to enhance biocompatibility and cell uptake, respectively. The effectiveness of Gd-PSQ particles as T1-weighted MRI contrast agents was demonstrated in vitro on a 3T MR scanner using H460 and AsPC-1 cancer cells, which was confirmed by confocal laser scanning microscopy and ICP-MS studies. The high loading of Gd chelates, biodegradability, and high MR sensitivity of Gd-PSQ particles make them a promising new class of efficient MRI contrast agents.
4. Experimental Section
Synthesis of 2-(Pyridin-2-yldisulfanyl) cysteamine hydrochloride (a)
The synthesis of a was carried out by an established literature procedure.[16]
Synthesis of Bis(2-pyridyldisulfanyl ethylamido)diethylenetriamine pentaacetic acid dihydrochloride (b)
A mixture of a (0.80 g, 3.60 mmol) and DTPA dianhydride (0.52 g, 1.44 mmol) in anhydrous pyridine (10 mL) was magnetically stirred for 24 h. The crude product was isolated by precipitation with diethyl ether, and purified by repeated dissolution (up to 4 times) in a minimal volume of methanol followed by precipitation with diethyl ether to yield an off-white solid of b in a quantitative yield. 1H NMR (300 MHz, D2O, ppm): 2.97 (t, 4H), 3.30 (s, 8H), 3.52 (t, 4H), 3.69–3.78 (10H), 7.52 (t, 2H), 8.00 (d, 2H), 8.10 (t, 2H), 8.45 (d, 2H). MS (ESI positive ion): m/Z = 765.1 (expected 765.15), 730.1 (expected 730.18), and 801.1 (expected 801.11) for [M-Cl+H]+, [M-2Cl+H]+, and [M+H]+, respectively.
Synthesis of Gd(III) [Bis(2-pyridyldisulfanyl ethylamido)diethyl-enetriamine pentaacetic acid] (c)
The pH of a solution of b (0.73 g, 1.00 mmol) in water (10 mL) was adjusted from ~2 to ~10 via the addition of dilute NaOH (4.0 mL of 1 M, 4.0 eq). To this solution, GdCl3 (0.364 g, 0.98 mmol) in water (1 mL) was added dropwise. The resulting solution with a pH value of ~3.5 was magnetically stirred for an additional 6 h. The solvent was removed via rotary evaporation. The crude product was purified by repeated dissolution (up to 4 times) in a minimal volume of methanol followed by precipitation with diethyl ether to lead to an off-white solid of c in a quantitative yield. MS (ESI positive ion): m/Z = 885.1 (expected 885.11), 906.9 (expected 906.10), and 956.0 (expected 956.01) for [M-2Cl+2H]+, [M-2Cl+Na+H]+, and [M+2H]+, respectively.
Synthesis of Gd(III) [Bis(triethoxysilylpropyl cysteamido)diethylenetriamine pentaacetic acid] (1)
To a solution of c (0.20 g, 0.22 mmol) in ~3.5 mL of methanol 3-mercaptopropyl triethoxysilane (0.13 mg, 0.56 mmol) was added, and the resulting solution was magnetically stirred at room temperature for ~12 h. Diethyl ether was added to the solution to precipitate the product, which was further purified by repeated dissolution (up to 4 times) in a minimal volume of methanol followed by precipitation with diethyl ether to give an off-white solid of 1. Yield: 185 mg (73%). MS (ESI positive ion): m/Z = 869.3 (expected 869.84), [M-6EtO+2H]+.
Synthesis of 2-(Pyridin-2-yldisulfanyl)cysteine hydrochloride (a’)[14]
A solution of cysteine hydrochloride (1.58 g, 10.0 mmol) in methanol (20 mL) was added dropwise to a magnetically stirred mixture of 2,2′-dipyridyl disulfide (4.4062 g, 20.0 mmol) and acetic acid (800 μL) in methanol (20 mL) over a period of 30 min. After stirring at room temperature for an additional 24 h, the solvent was removed from the mixture by rotary evaporation. The product was isolated by precipitating from a concentrated methanol solution of the crude mixture with diethyl ether. This washing/precipitation procedure was repeated 5 times to lead to a white crystalline product. Yield: 2.14 g (80.0%). 1H NMR (400 MHz, DMSO-d6, ppm): 3.39 (m, 2H), 4.19 (t, 1H), 7.31 (t, 1H), 7.735 (d, 1H) 7.82 (t, 1H), 8.52 (d, 1H), 8.78 (s, broad 2H corresponding to NH2). MS (ESI positive ion): m/Z = 230.8 (expected 230.85), 460.9 (expected 460.95), for [M+H]+, and [2M+H]+, respectively.
Synthesis of Bis(2-pyridin-2-yldisulfanyl cysteineamido)diethylenetriamine pentaacetic acid dihydrochloride (b’)
A solution of a’ (1.95 g, 7.06 mmol) in 45 mL of dry DMSO was added dropwise to a solution of DTPA dianhydride (1.26 g; 43.53 mmol) in 45 mL of dry DMSO. After the addition of diisopropy-lethylamine (DIEA) (1.23 mL, 7.06 mmol), the resulting solution was stirred at room temperature for 48 h. The product was precipitated by the addition of acetone and diethyl ether. The solid residue was purified by repeated dissolution (up to 4 times) in a minimal volume of methanol followed by precipitation with diethyl ether. Yield: 1.50 g (52%). 1H NMR (400 MHz, DMSO-d6, ppm): 2.92 (t, 4H), 3.08 (t, 4H), 3.29 (d, 4H), 3.34 (s, 4H), 3.43 (s, 4H), 3.57 (s, 2H), 4.48 (t, 2H), 7.22 (t, 2H), 7.74 (t, 2H), 7.79 (t, 2H), 8.44 (d, 2H), 8.49 (s, 1H-NH), 8.51 (s, 1H-NH). MS (ESI positive ion): m/Z = 818.16 (expected 818.15), 840.14 (expected 840.14), for [M+H]+, and [M+Na]+, respectively.
Synthesis of Gd(III) [Bis(2-pyridyldisulfanyl cysteinamido)diethylenetriamine pentaacetic acid] (c’)
The pH of a solution of b’ (1.00 g, 1.22 mmol) in water (14 mL) was adjusted from ~3.5 to ~9.3 via the addition of dilute NaOH (~7.1 mL, 1 M, 5.8 eq). To this solution GdCl3 (0.43 g, 1.16 mmol, 0.95 eq) in water (2 mL) was added dropwise. The resulting solution with a pH of ~4.5 was magnetically stirred for an additional 6 h at room temperature. The solvent was removed via rotary evaporation. The solid residue was purified by repeated dissolution (up to 5 times) in a minimal volume of methanol followed by precipitation with diethyl ether to yield an off-white product. Yield: 1.03 g (95%). MS (ESI positive ion): m/Z = 995.04 (expected 995.05), 1017.01 (expected 1017.03), and 1039.00 (expected 1039.03) for [M+Na]+, [M-H+2Na]+, and [M-2H+3Na]+, respectively.
Synthesis of Gd(III) [Bis(triethoxysilylpropyl cysteinamido) diethylenetriamine pentaacetic acid] (2)
To a solution of c’ (0.80 g, 0.81 mmol) in 67 mL of methanol 3-mercaptopropyl triethoxysilane (454 μL, 1.78 mmol) was added. The resulting solution was stirred at room temperature for 24 h. After the reaction was complete, diethyl ether was added to the solution to precipitate the product, which was then purified by repeated dissolution (up to 4 times) in a minimal volume of methanol followed by precipitation with diethyl ether to afford an off-white product. Yield: 0.65 mg (65.6%). MS (ESI positive ion): m/Z = 955.8 (expected 955.82), [M-6EtO]+.
Synthesis of PSQ-1
A solution of 1 (57.0 mg, 0.05 mmol) in water (7.6 mL) was freshly prepared and added to a magnetically stirred solution of 0.3 M Triton X-100/1.5 M 1-hexanol/cyclohexane (100 mL), quickly followed by the addition of aqueous NH4OH (0.50 mL). The resulting microemulsion with a W value of 15 was stirred at room temperature for an additional 24 h. The PSQ-1 particles were isolated by the addition of an equivalent volume of ethanol, followed by centrifugation at 13 000 rpm. The particles were subsequently washed with ethanol before being redispersed in ethanol. Low molecular weight contaminants were removed by dialyzing the material against dilute phosphate buffered saline (pH 7) using 3500 MW cutoff cellulose dialysis tubing. The remaining nanoparticles were collected and dispersed in distilled water. Yield: 23.9 mg (42.0%).
Synthesis of PSQ-2
A solution of 2 (23.4 mg, 0.019 mmol) in water (2.03 mL) was freshly prepared and added to a magnetically stirred solution of 0.3 M Triton X-100/cyclohexane (37.5 mL), quickly followed by the addition of aqueous NH4OH (0.19 mL). The resulting microemulsion was stirred at room temperature for an additional 24 h. The PSQ-2 particles were isolated by the addition of an equivalent volume of ethanol followed by centrifugation at 13 000 rpm. The particles were subsequently washed with ethanol, PBS (pH 3.0, 10 mM), and PBS (pH 7.4, 10 mM) before being redispersed in ethanol. Low molecular weight contaminants were removed by dialysis of the material against dilute PBS (pH 7.4, 1 mM) using 3500 MW cutoff cellulose dialysis tubing. Yield: 8.5 mg (36.4%).
Release Profile Studies
4.0 mL of an ethanolic suspension of PSQ particles (0.86 mg/mL) were centrifuged to isolate the particles, which were then redispersed in 5 mL of PBS (1 mM, pH 7.4). This suspension was placed inside a piece of dialysis tubing (3500 MW cutoff). 400 mL of PBS (1 mM, pH 7.4) in an air-tight container and was preheated under nitrogen at 37 °C in an oil bath. The dialysis bag containing the particles was then quickly submerged in the PBS buffer. Aliquots were removed at various time points to establish the baseline release. After a few hours, a 50 mL aliquot was removed from the container, and replaced with a 50 mL solution containing 0.63 g (4.0 mmol) of L-cysteine·HCl to give a final cysteine concentration of 10 mM. Aliquots were again removed at various time points to establish the cysteine-triggered release profiles. For the ICP-MS analysis, each aliquot removed from the container was diluted in 3.0 mL of 0.6 M nitric acid. The Gd content of each sample was then measured using ICP-MS.
PEGylation of PSQ-2
The carboxylic acid groups in PSQ-2 were used to couple with amino-polyethyleneglycol monomethyl ether [H2N-PEG(5K)] via an amide linkage. PSQ-2 (10 mg) was treated with 1-ethyl-3-[3-dimethylaminopropyl] carbodiimide (EDC, 50 mg) (coupling agent) and H2N-PEG(5K) (100 mg) in dry acetonitrile at room temperature for 24 h to afford PEG-PSQ-2. The synthesis of H2N-PEG(5K) has been reported in the literature.[4g]
Synthesis of Anisamide-Modified PEG-PSQ-2 (AA-PEG-PSQ-2)
The synthesis of anisamide-modified PEG-PSQ-2 was carried out via a coupling reaction of PSQ-2 (10 mg) in dry acetonitrile, using 1-ethyl-3-[3-dimethylaminopropyl] carbodiimide (EDC, 50 mg) as coupling agent, with 100 mg of a mixture of H2N-PEG(5K) and anisamide-functionalized PEG-NH2(5K) (70:30 wt/wt) for 24 h at room temperature. The synthesis of AA-PEG-NH2(5K) has been reported in the literature.[4g]
Synthesis of FITC-Labeled PSQ-2 Nanoparticles
To prepare FITC-PSQ-2 particles, a FITC-silane derivative (FITC-AP-TES) was first prepared. Briefly, a solution of FITC-AP-TES was prepared by adding 6.8 mg (0.0175 mmol) of FITC in 1.1 mL of dry DMSO; to this solution, 4.95 μL (4.65 mg, 0.0211 mmol) of 3-aminopropyltri-ethoxysilane was added, and the reaction was stirred at room temperature in the dark for 6 h. The final solution was diluted to 3 mL with additional dry DMSO to make a 6 mM FITC-AP-TES solution. The FITC-PSQ-2 nanoparticles were prepared in a similar fashion as PSQ-2 with the exception of adding 50 μL of the FITC-AP-TES solution to the reverse microemulsion. FITC-PSQ-2 particles were modified with PEG and AA-PEG in the same fashion as PSQ-2.
Confocal Microscopy Imaging of H460 and AsPC-1 Cells
Either H460 or AsPC-1 cells were plated in a 6-well plate with silanized coverslips at a cell density of 3 × 10⁵ cells/well in 1 mL media per well. The plate was incubated for 24 h to promote cell attachment (5% CO2, 37 °C). After the media was removed, wells were washed once with PBS. Fresh media containing FITC-labeled PEG-PSQ-2 or AA-PEG-PSQ-2; was then added (100 μg mL−1). The plates were incubated for 12 h. After the media was removed, wells washed with PBS and 1 mL fresh media added to each well. Coverslips were adhered onto glass slides with antifade mounting medium. Images were obtained using a Zeiss LSM5 Pascal inverted confocal laser scanning microscope. The FITC dye was imaged using 490 nm excitation and a 525 nm long pass emission filter.
T1-Weighted MR Imaging of Monocyte Cells
Monocyte cells were trypsinized for 5 min at 37 °C and 5% CO2 before collection by low speed centrifugation. The cell concentration was determined by trypan blue exclusion. Approximately 2.0 × 10⁶ monocytes were placed in a culture dish with 1 mL of media and 200 μL of PSQ-1 nanoparticles (0.100 mg). After 1 h of incubation, the cells were washed with fresh media twice and pelleted. A final layer of PBS (200 μL) was added on top of the pellets for MR imaging studies.
T1-Weighted MR Imaging of H460 and AsPC-1 Cells
Confluent H460 or AsPC-1 cells were trypsinized, and an aliquot of cell suspension was added to each 25 mL culture flask to obtain a cell density of 1.0 × 10⁶ cells/flask, followed by 7 mL RPMI-1640 complete growth medium (Cellgro). The flasks were incubated (37 °C, 5% CO2) for 36 h. The media was then removed and replaced with 5.0 mL fresh media containing PSQ-2, PEG-PSQ-2, and AA-PEG-PSQ-2. The final Gd-PSQ concentration was 100 μg mL−1. After incubating for 12 h, the cells were trypsinized, resuspended in 200 μL PBS, and centrifuged at 3000 rpm for 15 min to obtain cell pellets. T1-weighted images of the pellets were obtained on a 3.0 T MR scanner.
Determination of the Amount of Gd Internalized by H460 and AsPC-1 Cells
The cell pellets were prepared in the same fashion as described above for the MR imaging experiment. Cell pellets were digested in concentrated HNO3 for 12 h and diluted to 4 mL with MilliQ water. The samples were filtered through Nalgene PTFE 0.2 μM syringe filters to remove undigested cellular material. The amount of Gd(III) incorporated with each cell pellet was then determined by ICP-MS.
Supplementary Material
Acknowledgments
This work was supported by the NCI (U01-CA151455 and U54-151652). The authors thank the staff of the Biomedical Research Imaging Center at UNC-Chapel Hill for help with MRI studies. JLV-E thanks the Carolina Postdoctoral Program for Faculty Diversity for a postdoctoral fellowship. WJR was a National Science Foundation predoctoral fellow. HL acknowledges the HHMI-FSC for summer research fellowships.
Footnotes
Supporting Information
Supporting Information is available from the Wiley Online Library or from the author.
References
- 1.a) Cho EC, Glaus C, Chen J, Welch MJ, Xia Y. Trends Mol Med. 2010;16:561–573. doi: 10.1016/j.molmed.2010.09.004. [DOI] [PMC free article] [PubMed] [Google Scholar]; b) Choi HS, Frangioni JV. Mol Imaging. 2010;9:291–310. [PMC free article] [PubMed] [Google Scholar]; c) Hahn MA, Singh AK, Sharma P, Brown SC, Moudgil BM. Anal Bioanal Chem. 2011;399:3–27. doi: 10.1007/s00216-010-4207-5. [DOI] [PubMed] [Google Scholar]
- 2.a) Caravan P. Chem Soc Rev. 2006;35:512–523. doi: 10.1039/b510982p. [DOI] [PubMed] [Google Scholar]; b) Caravan P, Ellison JJ, McMurry TJ, Lauffer RB. Chem Rev. 1999;99:2293–2352. doi: 10.1021/cr980440x. [DOI] [PubMed] [Google Scholar]; c) Pan D, Schmieder AH, Wickline SA, Lanza GM. Tetrahedron. 2011;67:8431–8444. doi: 10.1016/j.tet.2011.07.076. [DOI] [PMC free article] [PubMed] [Google Scholar]
- 3.a) Della Rocca J, Lin W. Eur J Inorg Chem. 2010:3725–3734. [Google Scholar]; b) Kozlowska D, Foran P, MacMahon P, Shelly MJ, Eustace S, O’Kennedy R. Adv Drug Deliv Rev. 2009;61:1402–1411. doi: 10.1016/j.addr.2009.09.003. [DOI] [PubMed] [Google Scholar]; c) Lin W, Hyeon T, Lanza GM, Zhang M, Meade TJ. MRS Bull. 2009;34:441–448. doi: 10.1557/mrs2009.120. [DOI] [PMC free article] [PubMed] [Google Scholar]; d) Na HB, Hyeon T. J Mater Chem. 2009;19:6267–6273. [Google Scholar]; e) Na HB, Song IC, Hyeon T. Adv Mater. 2009;21:2133–2148. [Google Scholar]; f) Rieter WJ, Taylor KML, An H, Lin W, Lin W. J Am Chem Soc. 2006;128:9024–9025. doi: 10.1021/ja0627444. [DOI] [PMC free article] [PubMed] [Google Scholar]; g) Taylor-Pashow KML, Della Rocca J, Huxford RC, Lin W. Chem Commun. 2010;46:5832–5849. doi: 10.1039/c002073g. [DOI] [PubMed] [Google Scholar]; h) Villaraza AJL, Bumb A, Brechbiel MW. Chem Rev. 2010;110:2921–2959. doi: 10.1021/cr900232t. [DOI] [PMC free article] [PubMed] [Google Scholar]; i) Vivero-Escoto JL, Huxford-Phillips RC, Lin W. Chem Soc Rev. 2012;41:2673–2685. doi: 10.1039/c2cs15229k. [DOI] [PMC free article] [PubMed] [Google Scholar]
- 4.a) Duncan AK, Klemm PJ, Raymond KN, Landry CC. J Am Chem Soc. 2012;134:8046–8049. doi: 10.1021/ja302183w. [DOI] [PMC free article] [PubMed] [Google Scholar]; b) Lee JE, Lee N, Kim H, Kim J, Choi SH, Kim JH, Kim T, Song IC, Park SP, Moon WK, Hyeon T. J Am Chem Soc. 2010;132:552–557. doi: 10.1021/ja905793q. [DOI] [PubMed] [Google Scholar]; c) Steinbacher JL, Lathrop SA, Cheng K, Hillegass JM, Butnor KJ, Kauppinen RA, Mossman BT, Landry CC. Small. 2010;6:2678–2682. doi: 10.1002/smll.201001447. [DOI] [PMC free article] [PubMed] [Google Scholar]; d) Taylor KML, Kim JS, Rieter WJ, An H, Lin W, Lin W. J Am Chem Soc. 2008;130:2154–2155. doi: 10.1021/ja710193c. [DOI] [PubMed] [Google Scholar]; e) Taylor-Pashow KML, Della Rocca J, Lin W. Nanomaterials. 2012;2:1–14. doi: 10.3390/nano2010001. [DOI] [PMC free article] [PubMed] [Google Scholar]; f) Tsai C-P, Hung Y, Chou Y-H, Huang D-M, Hsiao J-K, Chang C, Chen Y-C, Mou C-Y. Small. 2008;4:186–191. doi: 10.1002/smll.200700457. [DOI] [PubMed] [Google Scholar]; g) Vivero-Escoto JL, Taylor-Pashow KML, Huxford RC, Della Rocca J, Okoruwa C, An H, Lin W, Lin W. Small. 2011;7:3519–3528. doi: 10.1002/smll.201100521. [DOI] [PMC free article] [PubMed] [Google Scholar]
- 5.Longmire M, Choyke PL, Kobayashi H. Nanomedicine. 2008;3:703–717. doi: 10.2217/17435889.3.5.703. [DOI] [PMC free article] [PubMed] [Google Scholar]
- 6.a) Bhave G, Lewis JB, Chang SS. J Urol. 2008;180:830–835. doi: 10.1016/j.juro.2008.05.005. [DOI] [PMC free article] [PubMed] [Google Scholar]; b) Kalb RE, Helm TN, Sperry H, Thakral C, Abraham JL, Kanal E. Br J Dermatol. 2008;158:607–610. doi: 10.1111/j.1365-2133.2007.08369.x. [DOI] [PubMed] [Google Scholar]; c) Perazella MA. Curr Drug Saf. 2008;3:67–75. doi: 10.2174/157488608783333989. [DOI] [PubMed] [Google Scholar]; d) Stratta P, Canavese C, Aime S. Curr Med Chem. 2008;15:1229–1235. doi: 10.2174/092986708784310396. [DOI] [PubMed] [Google Scholar]
- 7.a) Hu L-C, Khiterer M, Huang S-J, Chan JCC, Davey JR, Shea KJ. Chem Mater. 2010;22:5244–5250. [Google Scholar]; b) Hu L-C, Shea KJ. Chem Soc Rev. 2011;40:688–695. doi: 10.1039/c0cs00219d. [DOI] [PubMed] [Google Scholar]; c) Khiterer M, Shea KJ. Nano Lett. 2007;7:2684–2687. doi: 10.1021/nl071087q. [DOI] [PubMed] [Google Scholar]; d) Shea KJ, Loy DA. Chem Mater. 2001;13:3306–3319. [Google Scholar]; e) Zhao L, Loy DA, Shea KJ. J Am Chem Soc. 2006;128:14250–14251. doi: 10.1021/ja066047n. [DOI] [PubMed] [Google Scholar]
- 8.Della Rocca J, Huxford RC, Comstock-Duggan E, Lin W. Angew Chem. 2011;123:10514–10518. doi: 10.1002/anie.201104510. [DOI] [PMC free article] [PubMed] [Google Scholar]; Angew Chem Int Ed. 2011;50:10330–10334. doi: 10.1002/anie.201104510. [DOI] [PMC free article] [PubMed] [Google Scholar]
- 9.Owens DE, Peppas NA. Int J Pharm. 2006;307:93–102. doi: 10.1016/j.ijpharm.2005.10.010. [DOI] [PubMed] [Google Scholar]
- 10.a) John CS, Vilner BJ, Geyer BC, Moody T, Bowen WD. Cancer Res. 1999;59:4578–4583. [PubMed] [Google Scholar]; b) Li S-D, Huang L. Ann N Y Acad Sci. 2006;1082:1–8. doi: 10.1196/annals.1348.001. [DOI] [PubMed] [Google Scholar]; c) Nakagawa O, Ming X, Huang L, Juliano RL. J Am Chem Soc. 2010;132:8848–8849. doi: 10.1021/ja102635c. [DOI] [PMC free article] [PubMed] [Google Scholar]
- 11.Walkey CD, Chan WCW. Chem Soc Rev. 2012;41:2780–2799. doi: 10.1039/c1cs15233e. [DOI] [PubMed] [Google Scholar]
- 12.a) Duan H, Kuang M, Wang X, Wang YA, Mao H, Nie S. J Phys Chem C. 2008;112:8127–8131. [Google Scholar]; b) Issa B, Qadri S, Obaidat Ihab M, Bowtell Richard W, Haik Y. J Magn Reson Imaging. 2011;34:1192–1198. doi: 10.1002/jmri.22703. [DOI] [PMC free article] [PubMed] [Google Scholar]
- 13.a) Ke T, Feng Y, Guo J, Parker DL, Lu Z-R. Magn Reson Imaging. 2006;24:931–940. doi: 10.1016/j.mri.2006.03.009. [DOI] [PubMed] [Google Scholar]; b) Lu Z-R, Mohs AM, Zong Y, Feng Y. Int J Nanomed. 2006;1:31–40. doi: 10.2147/nano.2006.1.1.31. [DOI] [PMC free article] [PubMed] [Google Scholar]
- 14.a) Arpicco S, Dosio F, Brusa P, Crosasso P, Cattel L. Bioconjugate Chem. 1997;8:327–337. doi: 10.1021/bc970025w. [DOI] [PubMed] [Google Scholar]; b) Zong Y, Wang X, Jeong E-K, Parker DL, Lu Z-R. Magn Reson Imaging. 2009;27:503–511. doi: 10.1016/j.mri.2008.07.020. [DOI] [PMC free article] [PubMed] [Google Scholar]
- 15.Werner EJ, Datta A, Jocher CJ, Raymond KN. Angew Chem Int Ed. 2008;47:8568–8580. doi: 10.1002/anie.200800212. [DOI] [PubMed] [Google Scholar]
- 16.Chong PCS, Hodges RS. J Biol Chem. 1981;256:5064–5070. [PubMed] [Google Scholar]
Associated Data
This section collects any data citations, data availability statements, or supplementary materials included in this article.


