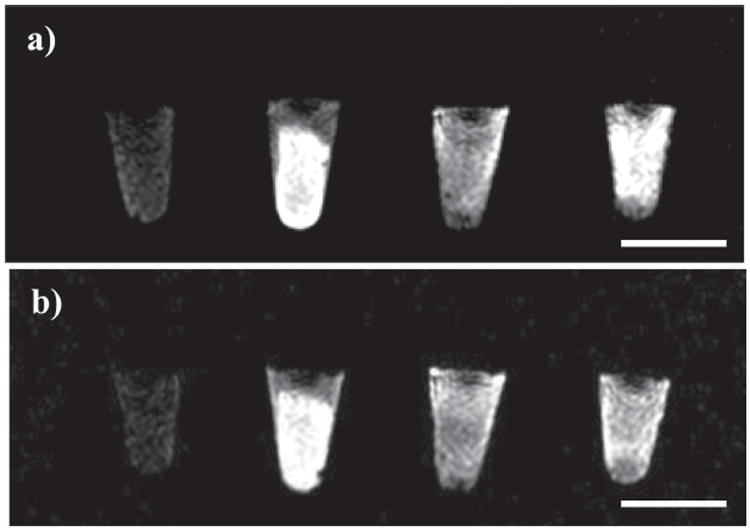
Figure 5.

T1-weighted images of H460 and AsPC-1 cell pellets. a) The images from left to right correspond to H460 cells incubated with no particles, AA-PEG-PSQ-2 (100 μg/mL), PEG-PSQ-2 (100 μg/mL), and PSQ-2 (100 μg/mL). b) The images from left to right correspond to AsPC-1 cells incubated with no particles, AA-PEG-PSQ-2 (100 μg/mL), PEG-PSQ-2 (100 μg/mL), and PSQ-2 (100 μg/mL). Scale bar is 5 mm.
