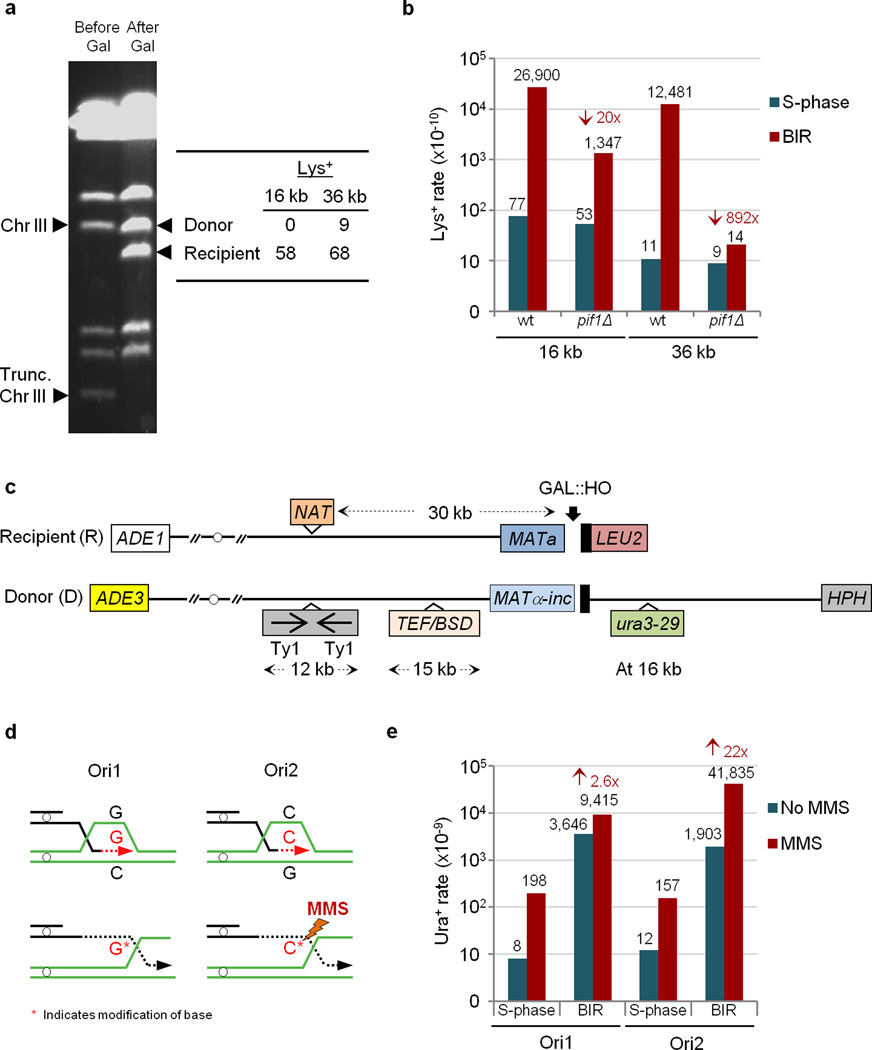
Figure 2. BIR-induced mutations.
a, The sequencing of the separated donor and recipient chromosomes of heterozygous Lys+ mutants. b, The effect of pif1Δ on BIR-induced frameshifts. Medians of mutation rates are shown. The arrows represent a reduction as compared to wt. c, The assay to study BIR-induced base substitutions in ura3–29 reporter. d, Depending on orientation, the selectable position of ura3–29 leading strand includes cytosine (C) or guanine (G). e, MMS amplifies BIR-induced base substitutions in orientation-dependent way. The arrows indicate an increase as compared to no-MMS control. See Extended Data Tables 1 and 2 for the details of statistical analysis and for the ranges of medians shown in e and b.

