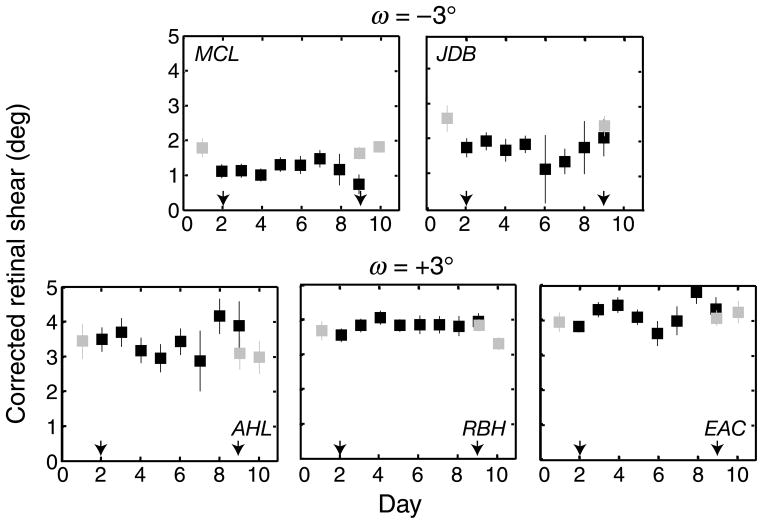
Figure 11.
Retinal shear angle before, during, and after wearing the distorting lenses. Corrected retinal shear angle is plotted for each day. The angle has been corrected for cyclovergence and for the shearing effects of the lenses. Thus, the plotted values reflect changes in the retinal positions of corresponding points. One measurement was made before putting the lenses on (gray squares), eight were made while the lenses were on (black squares), and two were made after the lenses were taken off (gray squares). The arrows indicate the days the lenses were first put on and first taken off. Error bars are 95% confidence intervals obtained by bootstrap.

