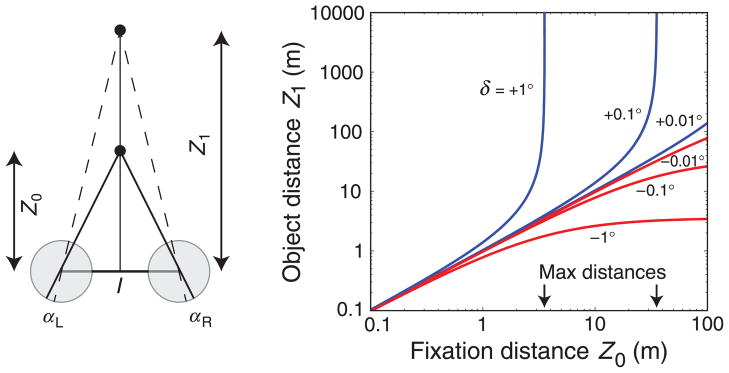
Figure 16.

The set of distances that can yield disparities of different values. (Left) The viewing geometry. A binocular observer with inter-ocular distance I fixates a point at distance Z0. Another object at distance Z1 stimulates the left and right retinas at locations αL and αR, respectively, creating horizontal disparity δ. (Right) Given disparity δ, different combinations of fixation and object distance are possible. Object distance Z1 is plotted as a function of fixation distance Z0, both in meters. The blue curves are the fixation–object combinations that can occur with positive (uncrossed) disparities and the red curves are the combinations that can occur with negative (crossed) disparities. Each curve is labeled with the specific disparity value, expressed in degrees. We assumed an inter-ocular distance I of 0.06 m.
