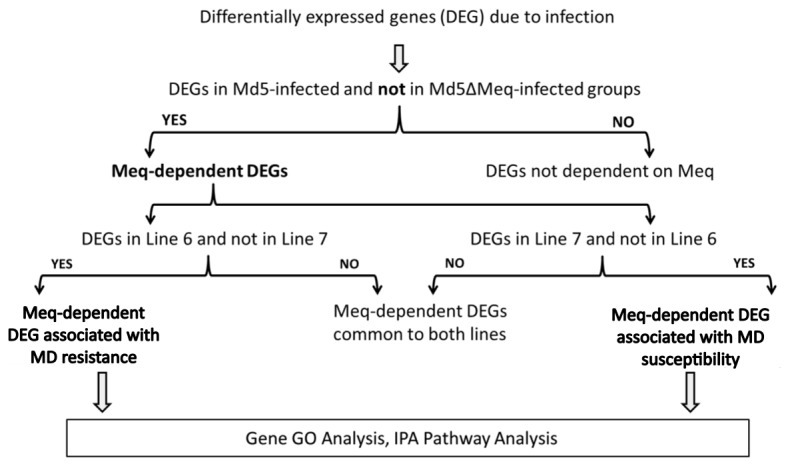
Figure 1. Schematic for analysis of experimental groups.

The differentially expressed genes (DEGs) between Md5-infected and Md5∆Meq-infected groups compared to untreated control CEFs were obtained. Then DEGs present in Md5-infected group and not in Md5∆Meq-infected group were designated as Meq-dependent DEGs. These were further divided into DEGs specific to lines 6 or 7, and this set was used for GO categorization and IPA Pathway analyses.
