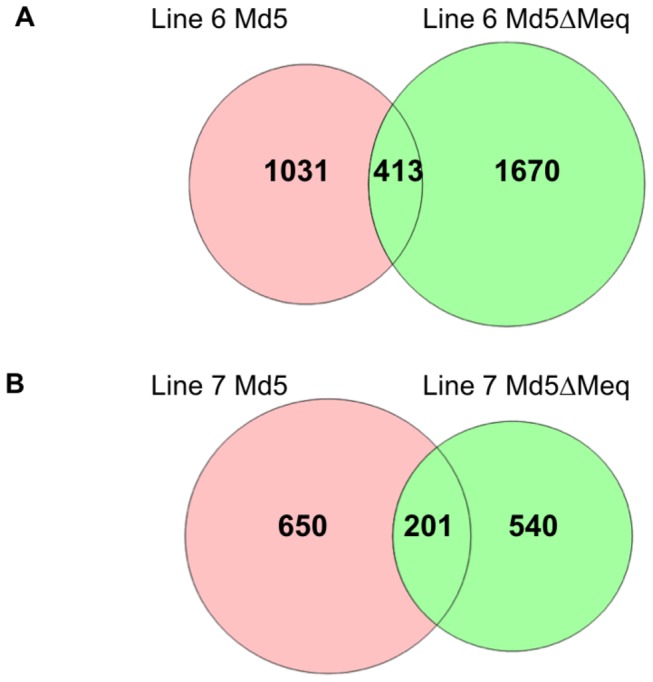
Figure 2. Identification of Meq-dependent genes in MD resistant or susceptible chicken lines.

Venn diagram of comparison between two virus-infected groups in line 6 and line 7. Each circle depicts the number of differentially expressed genes compared to uninfected controls. The portion highlighted in pink in each diagram denotes the Meq-dependent genes.
