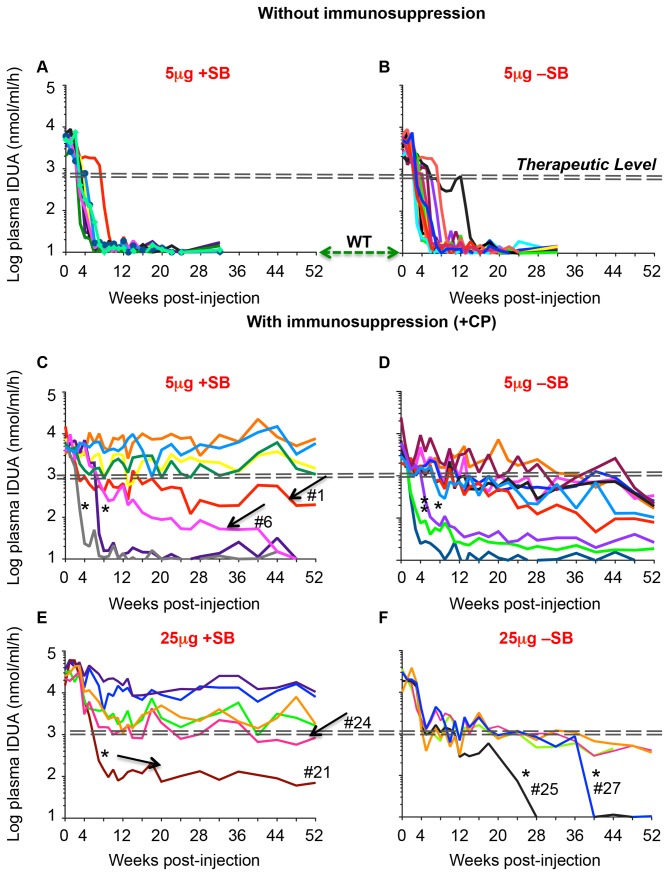
Figure 2. Expression of transgenic hIDUA in C57BL/6 mice.
Mice aged 12 weeks were treated with 5μg or 25μg pKT2/LSP-IDUA ± pCMV-SB100X at 5:1 and 10:1 weight ratio, respectively. Plasma IDUA activity in untreated controls (WT) was 10±4 nmol/ml/hr. The dashed double-lines indicate the therapeutic level [8]. Arrows indicate expression profiles of +SB-treated mice with gradual or incomplete loss of IDUA activity. Asterisks indicate rapid decay in CP-immunosuppressed mice. Numbers indicate mouse IDs as listed in Table 1 .

