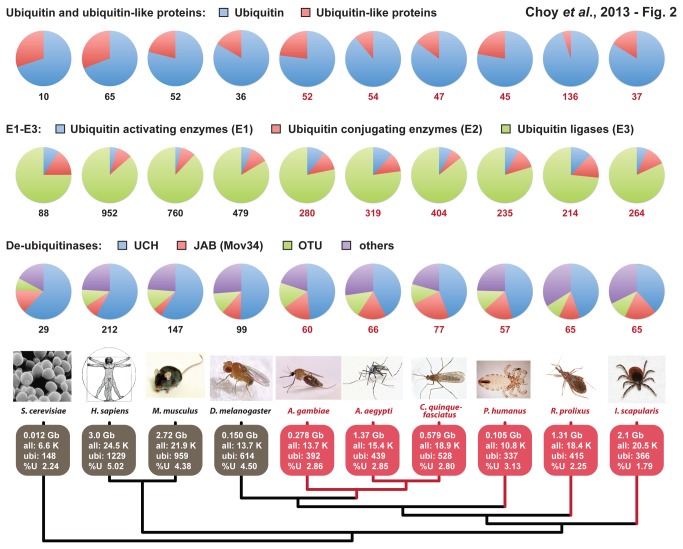
Figure 2. Proteins encoded for the ubiquitin machinery within the genomes of four model eukaryotes and six medically important arthropod vectors.
Ten species are depicted at bottom, with model organisms colored gray (S. cerevisiae, H. sapiens, M. musculus and D. melanogaster) and arthropod vectors colored red (A. gambiae, A. aegypti, C. quinquefasciatus, P. humanus, R. prolixus and I. scapularis). The statistics shown are genome size in giga base pairs (Gb) and “all” referring to total number of predicted genes. “Ubi” refers to the total number of characterized (model organisms) or predicted (vectors) ubiquitin machinery proteins encoded within each genome, with “%U” the proportion of ubiquitin-related genes. Proteins were categorized into three major groups: Ubiquitin and ubiquitin-like proteins, E1-E3 enzymes, and de-ubiquitinases. For each genome, a breakdown within each major group depicts the composition of protein families (sub-groups).

