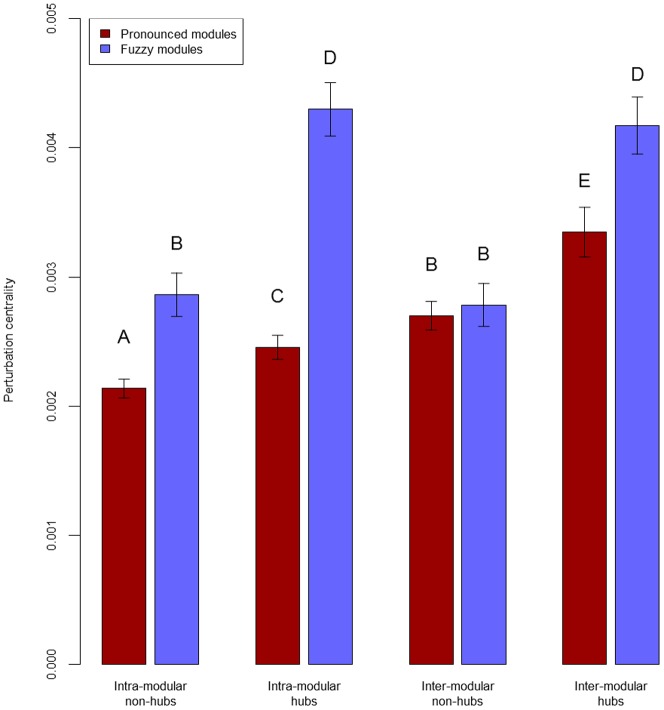
Figure 2. Average perturbation centralities for different node types in benchmark graphs.
Scale-free, modular benchmark graphs [28] were created as described in Supplementary Methods and Table S7 of Text S1. Average perturbation centralities were calculated as described in Methods using a starting perturbation of 40,000 units, since the benchmark networks contained 4,000 nodes. 4 node types were discriminated: intra-modular non-hubs, inter-modular non-hubs, intra-modular hubs and inter-modular-hubs, where hubs were nodes having a degree in the top 10%, and inter-modular nodes were nodes with more than 40% inter-modular edges. Different letters on top of the bars mark significantly different groups with α = 0.01 (Wilcoxon rank-sum test). Dark red bars show results obtained using 7 randomly selected benchmark graphs with the ratio of inter-modular nodes set to 0.05, termed as pronounced modules, while light blue bars display data for 7 randomly selected benchmark graphs (with the same seed nodes as the ones used for pronounced modules) with ratio of inter-modular nodes set to 0.4, termed fuzzy modules.

