Abstract
Purpose
The purpose of this study was to evaluate the metabolomic changes in 3D-cultured human mesenchymal stem cells (hMSCs) in alginate beads, so as to identify biomarkers during chondrogenesis using 1H nuclear magnetic resonance (NMR) spectroscopy.
Materials and Methods
hMSCs (2×10⁶ cells/mL) were seeded into alginate beads, and chondrogenesis was allowed to progress for 15 days. NMR spectra of the chondrogenic hMSCs were obtained at 4, 7, 11, and 15 days using a 14.1-T (600-MHz) NMR with the water suppression sequence, zgpr. Real-Time polymerase chain reaction (PCR) was performed to confirm that that the hMSCs differentiated into chondrocytes and to analyze the metabolomic changes indicated by the NMR spectra.
Results
During chondrogenesis, changes were detected in several metabolomes as hMSC chondrogenesis biomarkers, e.g., fatty acids, alanine, glutamate, and phosphocholine. The metabolomic changes were compared with the Real-Time PCR results, and significant differences were determined using statistical analysis. We found that changes in metabolomes were closely related to biological reactions that occurred during the chondrogenesis of hMSCs.
Conclusions
In this study, we confirm that metabolomic changes detected by 1H-NMR spectroscopy during chondrogenic differentiation of 3D-cultured hMSCs in alginate beads can be considered as biomarkers of stem cell differentiation.
Introduction
Regenerative medicine is a subdiscipline of tissue engineering, which aims to restore or establish normal functions of injured tissues and organs using human genes, proteins, and cells. This approach may involve the regeneration of tissues and organs by injecting stem cells or progenitor cells (cell therapies) and/or transplantation of in vitro-grown tissues [1]. Stem cells are able to divide and differentiate into different cell types. In adult organisms, stem cells have the ability to repair damaged tissues by regenerating autologous cells [2-4]. However, it is well recognized that some tissues or organs, such as adult articular cartilage, have a limited capacity for self-repair [5,6]. A previous study reported that the use of autologous chondrocyte transplantation (ACT) and cell-based therapy for healing articular cartilage defects minimized potential side-effects and was successfully employed in the clinical setting [6-8].
The identification of surrogate markers and biomarkers to provide structural, physiologic, and metabolomic information regarding cell status is essential for the assessment of therapeutic interventions in regenerative medicine [9]. Stem cell behavior cannot be easily addressed in vivo because exogenous cell markers are lost through degradation, dilution, and excretion as cell populations divide [10]. Accordingly, research into novel noninvasive biomarkers or surrogate parameters to visualize or analyze quantitatively them in vivo is expected to provide innovative diagnostic information without causing stress or physical trauma to patients. These new techniques are also expected to facilitate investigations of cellular metabolism without causing detrimental effects [9,11,12]. Early detection of biomarkers of treatment efficacy at the cellular or molecular level is crucial and challenging in clinical applications of regenerative medicine [13].
Microscopic anatomic information about cells and tissues is usually obtained through histologic analyses. However, most of these techniques require an invasive process, such as extraction of tissue, formalin fixation, and chemical reactions that cause denaturalization by reaction with reagents [14-18]. Nuclear magnetic resonance spectroscopy (NMR), which is another powerful tool for molecular structural characterization, can be used to acquire metabolomic information from tissues [19,20]. Several investigators have attempted to establish a noninvasive biomarker by observing cell activities, such as cell death or differentiation, using NMR [13,20,21]. In clinical applications, magnetic resonance spectroscopy (MRS) offers the potential to identify such noninvasive biomarkers by the detection of in vivo metabolic changes occurring in abnormal tissues prior to the alterations becoming apparent by magnetic resonance imaging (MRI). However, clinical MRS analyzes only a low number of metabolomes, and the cellular mechanisms underlying alterations are poorly understood. In vitro MRS or NMR studies allow systematic assessment of many metabolomes, which may provide valuable information about cellular processes [13].
In the present study, metabolomic changes in three-dimensional (3D)-cultured human MSCs (hMSCs) immobilized in alginate beads were evaluated during chondrogenic differentiation to identify biomarkers using 1H-NMR.
Materials and Methods
Cell culture
Bone marrow-derived hMSCs (Cambrex BioScience Co., Walkersville, MD, USA) were cultured in Mesencymal Stem Cell Growth Medium (MSCGM) that contained L-glutamine, gentamicin sulfate, amphotericin B, and mesenchymal cell growth supplement (Lonza Ltd., Portsmouth, NH, USA) and incubated at 37°C in an atmosphere of 95% air and 5% CO2. The medium was replaced every 4–5 days. Subconfluent cells were subcultured using trypsin (Lonza Ltd.) for six passages [22].
3D chondrogenesis culture
Trypsinized hMSCs were centrifuged at 1500 rpm for 3 min. The cells were resuspended in chondrogenic induction medium (CIM; Dulbecco’s Modified Eagle’s Medium [DMEM] high glucose, ITS+ [Becton Dickinson Co., Franklin Lakes, NJ, USA] at 100:1 dilution, ascorbic acid at 50 µg/mL [Sigma Chemical Co., St. Louis, MO, USA], transforming growth factor-β3 at 10 ng/mL [Peprotech Inc., Rocky Hill, NJ, USA], and dexamethasone at 100 nM [Sigma]) [22-24]. A suspension of 2×10⁶ cells was mixed with an equal volume of 2.4% (w/v) alginate gel. Alginate beads were formed using a syringe with a 23-G needle and solidified using 102 mM CaCl2 for 5 min. The alginate beads were washed three times with phosphate-buffered saline (PBS). The final cell density in the alginate beads was 2×10⁶ cells/mL.
Alginate bead lysis
Alginate beads were lysed to collect cell pellets for Real-Time PCR and cell counting after the acquisition of NMR data 20 alginate beads per experimental group were dissolved in lysis solution that contained 150 mM sodium chloride and 55 mM sodium citrate. The mixtures were incubated for 5–10 min at 37°C in 5% CO2 [25]. The alginate beads were released by pipetting and were centrifuged. After the supernatant was aspirated, the pellet was suspended in PBS, and the number of cells therein was counted.
NMR sensitivity test sample preparation
The optimal cell density for MRI signal acquisition was investigated by scanning alginate beads that contained the following numbers of hMSCs per mL: 5×10⁴, 5×10⁵ (low), 2×10⁶, 5×10⁶ (intermediate), and 1×10⁷ (high). In general, ~105 cells/mL was considered to be a low density of cells, ~106 cells/mL an intermediate density, and ~107 cells/mL a high density [7,26,27]. Three samples per group were prepared in 5-mm NMR tubes (Optima Inc., Elk Grove Village, IL, USA).
NMR sample preparation
D2O saline (0.9% NaCl in 99.9% deuterium water, D2O) was used as the NMR locking solvent to maintain the osmotic pressure of the cells. Cultured alginate beads were washed in D2O saline three times before NMR scanning, to remove the water signal from the medium. Washed alginate beads were placed in 5-mm NMR tubes with D2O saline that contained 1 mM TSP (3-[trimethylsilyl] propionic-2,2,3,3-d4 acid sodium salt) in a 500-μL volume. TSP was used as a NMR standard reference material for calibration of the 0-ppm spectral peak position.
1H-NMR data acquisition and processing
NMR data were acquired using a 600-MHz micro-imaging/NMR machine (14.1 T, DMX 600; Bruker Co., Karlsruhe, Germany). Spectra were obtained using the water suppression sequence, zgpr (Bruker standard sequence). The 90° pulse calibration and shimming were conducted based on each sample before data acquisition. A repetition time of 2 s and data acquisition point of 16000 were used. The number of scans was 512 for the acquisition of each spectrum. The final scan time was 24 min, 51 s. The acquired data were processed using NUTS (Acorn NMR Inc., Livermore, CA, USA). A line broadening of 2 Hz was applied to the FID data before Fourier transform (FT). Baseline and phase correction were performed after FT. All spectra were normalized to the TSP peak to quantify the metabolomic changes that occurred during the differentiation of hMSCs.
RNA purification and Real-Time PCR
RNA was prepared from hMSCs and chondrogenic hMSC pellets that had been washed three times with PBS. RNA was purified using an RNA purification kit (RNeasy Mini kit; Qiagen, Hilden, Germany) and converted to cDNA using a high-capacity RNA to cDNA kit (Applied Biosystems Inc., Foster, CA, USA). Real-Time PCR was performed using primers designed with the Primer Express 3.0 software (Applied Biosystems). The mRNAs that encode GAPDH, collagen type I, and collagen type II were amplified. Table 1 lists the primer sequences. Real-Time PCR for the measurement of gene expression levels was performed using forward and reverse primers in a SYBR green PCR master mix (Applied Biosystems), as described previously [24,28].
Table 1. Description of primers designed for PCR.
| Organism | Gene | Accession No. | Primer sequence, 5′3′ |
|---|---|---|---|
| Collagen type I | NM_000088.3 | Forward: CAGACAAGCAACCCAAACTGAA | |
| Reverse: TGAGAGATGAATGCAAAGGAAAAA | |||
| Homo | Collagen type II | NM_001844.4 | Forward: GCCAACGTCCAGATGACCTT |
| sapiens | Reverse: CTTGCAGTGGTAGGTGATGTTCT | ||
| GAPDH | NM_002046.3 | Forward: CCAGGTGGTCTCCTCTGACTTC | |
| Reverse: GTGGTCGTTGAGGGCAATG |
DNA assays and cell counting
DNA assays and cell counting were performed to verify the optimal number of cells required for NMR analysis, which was determined using the NMR sensitivity test. Cell pellets for DNA assays were lysed using 0.1% Triton X-100 and centrifuged at 13,000 rpm at 4°C. Then, 100 μL of the supernatant were transferred to the wells of a 96-well plate with 100 μL of PicoGreen fluorescence reagent (Invitrogen Co., Grand Island, NY, USA). DNA standards were prepared using the same procedure. Fluorescence was measured in a multi-detection reader and was compared with the standard DNA curve. Cells extracted from alginate beads were dissolved in 1 mL PBS and enumerated using a hemocytometer. The intensities of NMR spectra from chondrogenic hMSCs cultured in alginate beads were normalized to cell density.
Statistical analysis
All NMR experiments were performed in duplicate. Thus, all the results were derived from two independent experiments, each of which included at least three samples. One-way ANOVA tests were used to analyze multiple sets of data at a significance level of p < 0.05 with Leven’s homogeneity test and post-hoc Tukey’s or, where appropriate, Dunnett’s T3 test [29]. Statistical analysis was conducted using the SPSS ver. 16.0 software (IBM Co., Armonk, NY, USA). Furthermore, we investigated the relationship between chondrogenesis and metabolomic changes using the NMR spectra obtained from repeated experiments, to identify a biomarker of hMSC chondrogenesis.
Results
NMR sensitivity
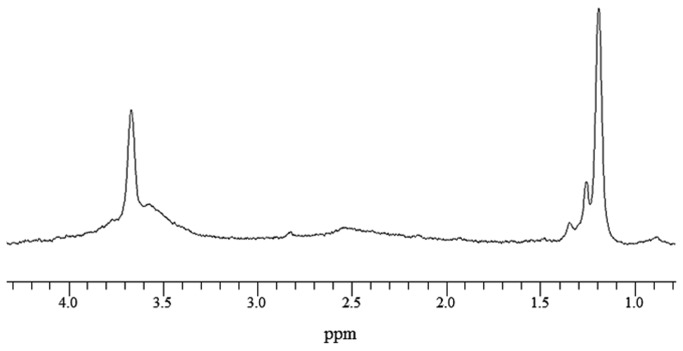
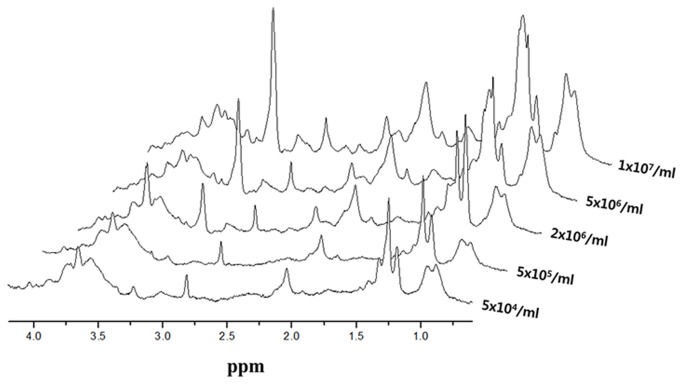
The NMR spectrum of alginate without cells was acquired as a reference (Figure 1). Linear intensity changes on NMR spectra according to cell density were observed by comparing the integral value of cell metabolomic peaks based on 1 mM TSP. Cell metabolomes, glutamate at 2.35 ppm, and phosphocholine at 3.22 ppm (Figure 2) were observable with the naked eye when the cell density was ≥ 2×10⁶ cells/mL. Table 2 shows the quantitative analysis of each metabolome. Increment ratios (%) of peak intensity were compared based on samples with 5×10⁴ cells/mL. Increments of spectral peak areas > 20% were confirmed using samples with 2×10⁶ cells/mL.
Figure 1. NMR spectrum of alginate beads without cells.
Figure 2. NMR spectrum changes of hMSCs according to cell density.
Table 2. Ratios of metabolite peak changes based on 5×10⁴ cells/mL (%).
| ppm | 5×10⁵ cells/mL | 2×10⁶ cells/mL | 5×10⁶ cells/mL | 1×10⁷ cells/mL |
|---|---|---|---|---|
| 3.22 | 5.7 | 44.3 | 63.7 | 77.2 |
| 3.01 | 0.8 | 19.4 | 33.5 | 53.1 |
| 2.35 | 13.6 | 36.9 | 50.2 | 57.1 |
| 2.04 | 14.11 | 31.2 | 49.9 | 63.9 |
| 1.70 | 2.3 | 23.6 | 49.2 | 54.5 |
| 1.48 | 2.0 | 35.1 | 41.1 | 56.2 |
| 1.30 | 4.2 | 50.1 | 65.0 | 78.6 |
Normalization of NMR spectra to cell density
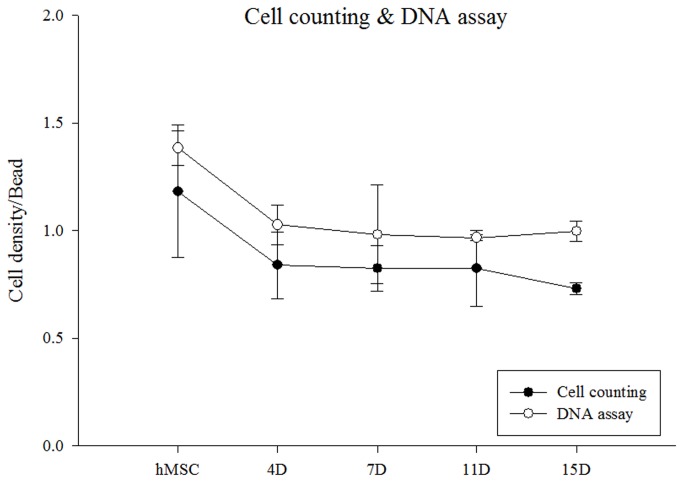
Cell counting and DNA assays were performed to measure the variations in cell density during chondrogenesis. Both methods gave similar trends, as shown in Figure 3. The hMSC density varied during the 15 days of differentiation into chondrocytes. Metabolomic peak intensity changed linearly with cell density during chondrogenesis. All the spectra were normalized to the cell counts.
Figure 3. Variation of cell density per alginate bead during chondrogenesis.
Spectral analysis
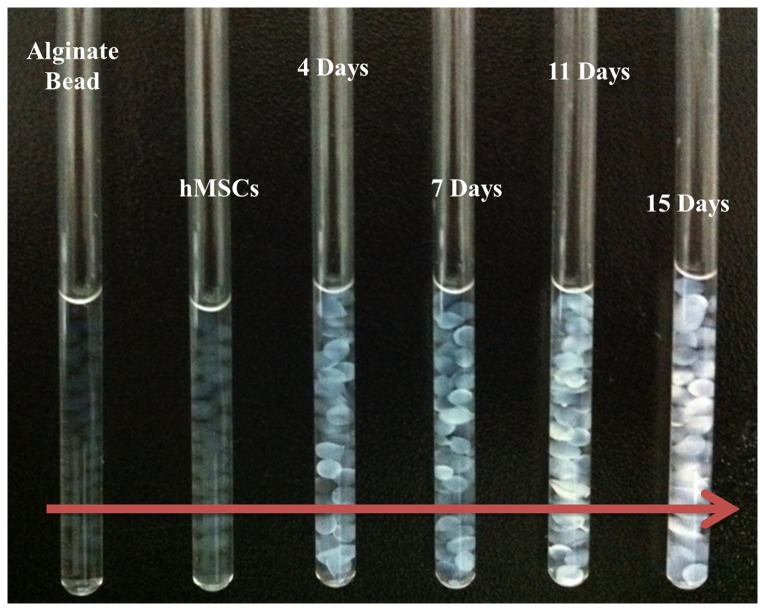
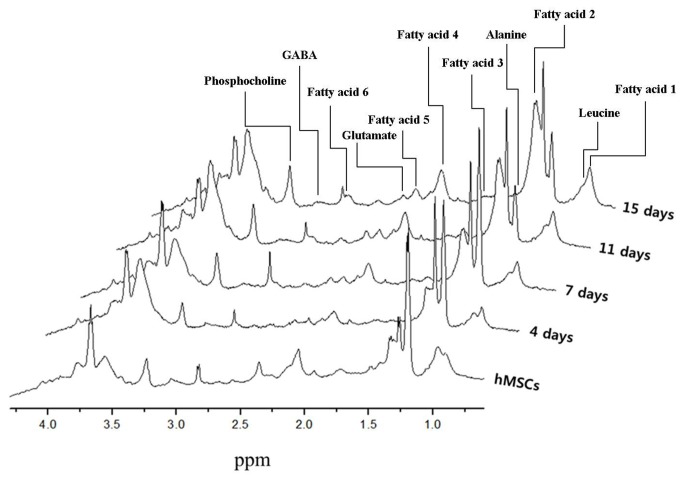
Figure 4 shows a photograph of chondrogenic hMSCs on alginate beads in an NMR tube used for acquiring NMR spectra. The alginate beads changed from a deep white color to appearing transparent during hMSC chondrogenesis. Three-dimensional perspective plots of the NMR spectra acquired at 4, 7, 11, and 15 days are shown in Figure 5.
Figure 4. Chondrogenic hMSCs in alginate beads in an NMR tube.
Figure 5. 3D perspective of NMR spectra of chondrogenic hMSCs cultured on alginate beads.
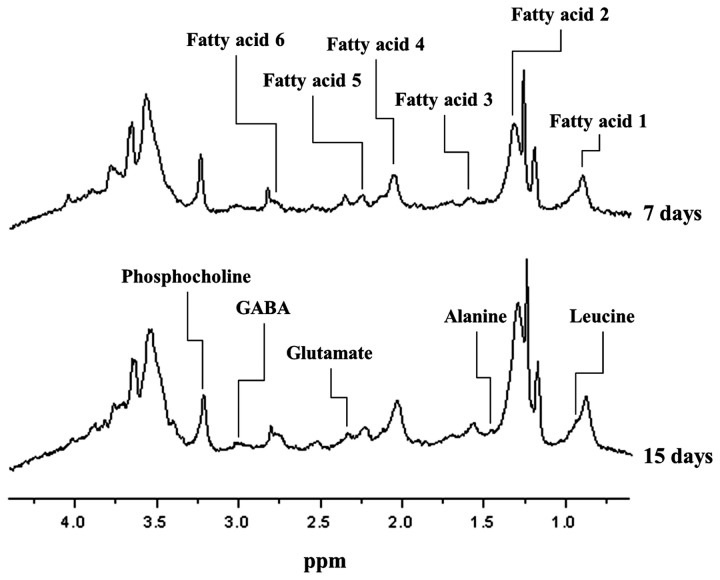
All metabolomic peaks derived from the chondrogenic hMSCs were selected, with the exception of the alginate peak shown in Figure 1. Cell metabolomic changes during chondrogenic differentiation of hMSCs were quantitatively analyzed by comparing the integral values of the peaks of the normalized NMR spectra. The metabolomes of the following changed during chondrogenesis: six fatty acids (see Table 3 and upper spectrum in Figure 6); leucine; alanine; glutamate; GABA (γ-aminobutyric acid); phosphocholine; and creatine (see Table 4 and lower spectrum in Figure 6) [20,21,30-32].
Table 3. Fatty acids changed during hMSC chondrogenic differentiation.
| Fatty acid | ppm | Chemical structure |
|---|---|---|
| 1 | 0.85–0.92 | -CH3 |
| 2 | 1.26–1.32 | -(CH2)n- |
| 3 | 1.54–1.63 | -OOC-CH2-CH2- + -O-CH2-CH2- + -CH2-CH-(CH3)2- |
| 4 | 1.99–2.10 | =CH-CH2-CH2 + =CH-CH2-CH3 |
| 5 | 2.20–2.26 | -COO-CH2-CH2- |
| 6 | 2.81–2.82 | -CH=CH2-CH= |
Figure 6. Displayed metabolomics on NMR spectra of chondrogenic hMSCs.
Table 4. Changes in levels of non-fatty acid metabolites during chondrogenesis.
| Name | ppm | Chemical structure |
|---|---|---|
| Leucine | 0.95 | δCH3 |
| 0.96 | δ'CH3 | |
| Alanine | 1.48 | βCH3 |
| Glutamate | 2.35 | γCH2 |
| GABA | 3.01 | 2CH2 |
| Creatine | 3.03 | CH3 |
| Phosphocholine | 3.22 | N-(CH3)3 |
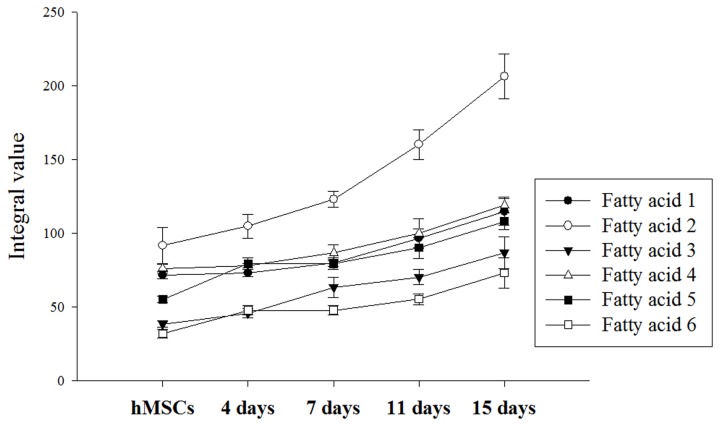
Figure 7 shows that levels of all of the fatty acids increased during chondrogenic differentiation. Fatty acid 3 at 1.58 ppm and fatty acid 6 at 2.75 ppm had the lowest initial values, but they increased rapidly starting on Day 4. In addition, both peaks were not evident the naked eye in the hMSC NMR spectrum, although it was confirmed that these peaks gradually increased after the start of chondrogenesis. The most significantly increased metabolome was fatty acid 2 at 1.30 ppm. This fatty acid doubled its starting concentration during the 15 days of chondrogenic differentiation. The chemical structure of each fatty acid is described in Table 3.
Figure 7. Fatty acid changes during chondrogenesis.
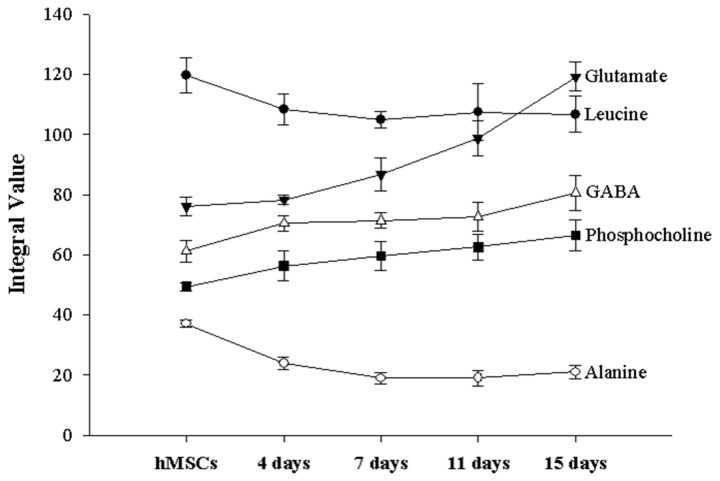
Other metabolomic changes were also observed (Table 4 and Figure 8). The metabolomes of leucine and alanine decreased 4-7 days after the initiation of chondrogenesis. In contrast, the levels of GABA, phosphocholine, and glutamate increased during chondrogenic differentiation. Creatine was detected only in pre-differentiated hMSCs.
Figure 8. Changes in levels of non-fatty acid metabolites during chondrogenesis.
Statistical analysis
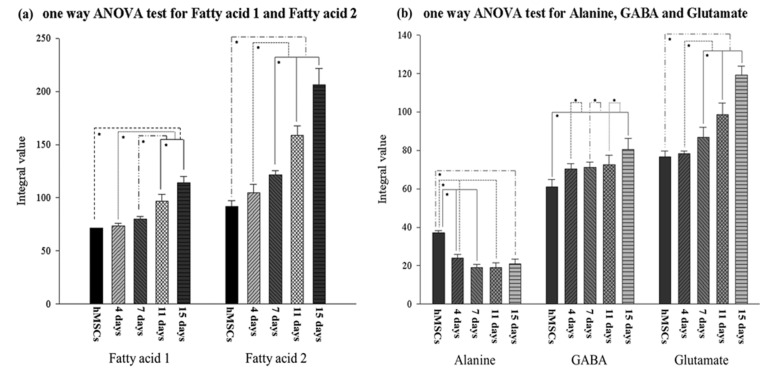
In this study, statistically significant alterations of NMR spectrum peak areas were found for fatty acid groups, alanine, GABA, and glutamate during the progression of hMSC-derived chondrogenesis, as depicted in Figure 9. In the cases of leucine and phosphocholine, there were significant differences between the non-induced hMSCs and chondrogenic hMSCs older than 7 days. However, significant differences were not observed among the different chondrogenic hMSC groups. Therefore, these results do not seem to be sufficient to define leucine and phosphocholine as chondrogenic markers without comparisons of additional metabolomic changes.
Figure 9. One-way ANOVA of cell metabolites according to duration of chondrogenic differentiation.
(a) Fatty acid 1, Tukey’s posteriori test; fatty acid 2, Dunnett’s T3 posteriori test. Statistical tests were performed for both the first and second hMSC chondrogenic differentiation experiments. (b) Alanine, GABA and glutamate. Tukey’s posteriori tests; *p < 0.05.
Figure 9(a) shows the metabolomic variations of fatty acid 1 and fatty acid 2 during chondrogenic differentiation. One-way ANOVA tests for fatty acid 1 showed no significant changes in the non-induced hMSCs (control) or induced hMSCs at Day 4 or Day 7 (p > 0.05), whereas the metabolomic variation of fatty acid 1 increased after Day 7 (Figure 9[a], left; p < 0.05). For fatty acids 2–6, no significant alterations (p > 0.05) between the control and Day 4 groups were observed, although there was a significant increase after Day 4 (p < 0.05). Fatty acid 2 showed the highest intensity integral mean value and the most rapid increments among the fatty acids. All the fatty acids may represent a chondrogenic differentiation marker that allows the estimation of the second half of differentiation (after 4 days for fatty acids 2–6 and after 7 days for fatty acid 1), as their metabolomic variations increased with differentiation time. Statistical analyses of other metabolomic alterations along the chondrogenic process were also conducted. It was confirmed that significant metabolomic changes occurred for GABA, alanine, and glutamate, as shown in Figure 9(b). Alanine showed significant reductions in the control, Day 4, and Day 7 cells; there were no statistical variations after Day 7 (p > 0.05). GABA showed a trend towards increasing peak areas. GABA significantly increased during the first 4 days from the start of differentiation, as well as at the last two time-points, Day 11 and Day 15. During the intermediate time-points, from Day 4 to Day 11, no significant changes in peak area were found. In the case of glutamate, gradual differentiation was observed from Day 7 to Day 15, as evidenced by significant changes between Days 7, 11, and 15. Among the various metabolomes, the largest changes were seen for glutamate, with the exception of the fatty acids (Figure 8). Alanine showed clear differences at an early differentiation stage (before Day 7), whereas glutamate rapidly increased in a late differentiation stage (after Day 7). Therefore, alanine and glutamate may be complementary chondrogenic markers.
Real-Time PCR
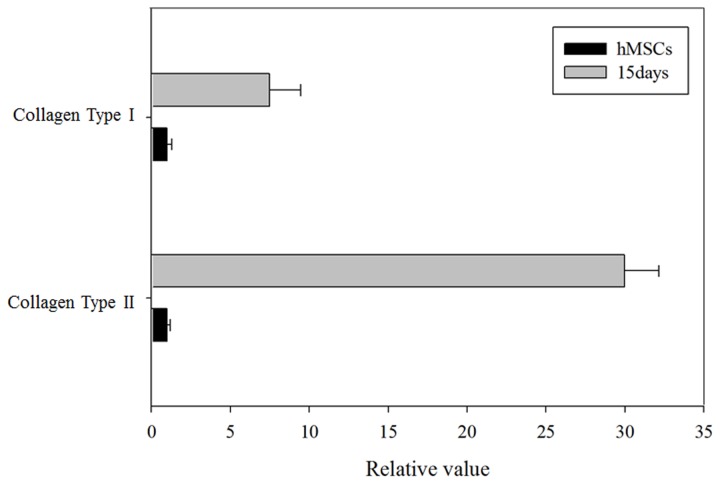
Real-Time PCR was performed to quantify the metabolomic changes in chondrogenic hMSCs. Figure 10 shows the gene expression levels for collagen types I and II. The expression level of each target gene was normalized to that of GAPDH. The gene expression level for each cell sample was normalized to that of non-induced hMSCs. The expression levels of the genes for collagen types I and II in chondrogenic hMSCs were much higher than those in non-induced hMSCs; indeed, the increased expression confirmed chondrogenic differentiation.
Figure 10. Real-Time PCR for the genes encoding collagen types I and II. The graph represents gene expression changes between non-induced hMSCs and hMSCs after 15 days of chondrogenesis. The level of hMSC gene expression was normalized to 1.0.
Discussion
In the present study, quantitative measurements of cell metabolomes during chondrogenesis of hMSCs were performed using NMR spectroscopy. NMR markers of chondrogenesis that can be used to estimate the differentiation stages of stem cells (hMSCs) were identified. Previous reports have suggested that collagen expression increases with chondrogenesis progression [24,33]. Therefore, we hypothesized that the metabolomic changes indicated by NMR spectra would correspond to hMSC chondrogenesis. Although in vivo MRI has advantages, such as being noninvasive and allowing high-contrast imaging of soft tissue, its sensitivity levels at the cellular and molecular levels are low. Cell-based techniques that utilize a 3D scaffold mimicking physiologic conditions show promise [23]. It is well known that scaffolds play an important role in dictating cell adhesion, differentiation, and proliferation by interacting with cells and culture media. To overcome the obstacle of obtaining sufficient autologous chondrocytes and then expanding them ex vivo in a monolayer culture, and to stimulate the chondrogenic phenotype, a 3D culture system using biocompatible alginate scaffolds is commonly used, both in vitro and in vivo, due to its mild gelation mechanism, its structural similarity to the extracellular matrix, and its low toxicity when purified [22,27]. Recent work has demonstrated the encapsulation and differentiation of hMSCs, which turn into cartilage-forming chondrocytes [5]. In the present study, a 3D cell culture differentiation method was adopted to overcome the low sensitivity of clinical MRI machines owing to its high cell capacity per unit volume, as compared with 2D culture [34]. An NMR sensitivity test at 14.1 T using various cell densities presented a spectral peak that was clearly detectable at cell densities of greater than 2×10⁶ cells/mL, as shown in Figure 2.
Biological functions of metabolomes
NMR spectroscopy facilitates the observation of metabolomes at the molecular level. In the present study, we monitored metabolomic changes that occurred during chondrogenic differentiation of hMSCs using NMR spectroscopy. Various biological changes were observed at the molecular level, as evidenced by spectral peak changes. In general, during viscerogenic chemical reactions, fatty acids are used as a resource for the tricarboxylic acid cycle (TCA; also known as the Krebs or citric acid cycle). This allows the synthesis of ATP (adenosine triphosphate) by hydrolyzing triglycerides into fatty acids [35,36]. We deduced that ATP synthesis was associated with the increased fatty acid levels detected during the chondrogenic process.
Creatine is indicative of cellular storage and supplies energy to the cell, particularly in muscle and brain tissues. Its levels are increased by the decomposition of phosphocreatine when ATP is being synthesized for energy supply [37,38]. In the present study, the creatine peak decreased rapidly after chondrogenesis and was not detectable in chondrogenic hMSCs. We infer that high-energy metabolism, which uses creatine, is restrained in chondrogenic hMSCs. Phosphocholine, at 3.22 ppm, represents choline storage in vivo and is related to the size of the cell membrane. It is also involved in the synthesis of lecithin, which is a type of phosphatidylcholine, by reacting with CTP (choline-phosphate cytidylyltransferase) [39-41]. Lecithin is a fatty substance that makes up 30%–50% of all phospholipids. As shown in Figure 8, phosphocholine is increased during chondrogenic differentiation, although cell proliferation was not detected by either DNA assays or cell counting in the present study. Thus, the increased phosphocholine level during chondrogenesis was likely caused by hMSC differentiation into chondrocytes rather than by proliferation [42,43]. We infer that chondrocytes are bulkier than hMSCs, as the phosphocholine level relates to the size of the cell membrane, which covers the entire cell, and is higher in chondrocytes than in hMSCs that do not proliferate. Furthermore, this result suggests that changes in cell volume can be monitored through NMR observation. No phosphocholine signal was present in the alginate beads or media alone. This indicates that the phosphocholine originated only from the cells (in this case, hMSCs and chondrocytes). For this reason, it is expected that phosphocholine, which induces the synthesis of phospholipids associated with the cell membrane, can be used as an NMR proliferation marker without using standard materials, such as TSP.
Chondrogenic differentiation marker
The levels of the following metabolomes were consistently altered: fatty acids, alanine, leucine, creatine, GABA, glutamate, and phosphocholine. In particular, fatty acids may represent an effective chondrogenic marker, as well as a marker that distinguishes between adipocytes and chondrocytes. A previous study showed that the metabolome contents of hMSCs changed after undergoing adipogenesis in vitro. Specifically, the level of fatty acid 1 increased 2.8-fold and 14-fold in two different studies, respectively. hMSCs undergoing chondrogenesis exhibited fewer metabolomic changes than those undergoing adipogenesis. The fatty acid levels increased during adipogenesis, although the peaks were distinct from those observed during chondrogenesis [20,21]. These results indicate that the differences in fatty acid profiles facilitate the discrimination of chondrogenesis and adipogenesis.
The alanine and leucine levels gradually decreased over the entire time course. Although the alanine levels were significantly different compared with the non-induced hMSCs, the leucine levels were not, despite following a similar downward trend. However, both metabolomes retained relatively consistent levels compared with other (increased) metabolomes just after the beginning of differentiation. Thus, the initiation of chondrogenesis can be identified by a reduction in alanine levels. Leucine, which did not show a statistically significant change, could be a supplementary marker of chondrogenesis. The GABA and glutamate levels increased significantly compared with the alanine and leucine levels. There were significant differences in glutamate levels in the advanced-stage hMSCs. In the case of GABA, there was a significant difference between the non-induced hMSCs and chondrogenic hMSCs on Day 15, but not with cells at other time-points. Therefore, glutamate can be considered a chondrogenic marker that signals the final stage, in contrast to alanine. GABA may also be a chondrogenic marker of the later phase of chondrogenesis, as it showed significantly different levels in non-induced hMSCs versus chondrogenic hMSCs at Day 15.
Conclusion
In conclusion, chondrogenic markers were identified for specific differentiation stages using NMR spectroscopic analysis of 3D-cultured hMSCs in alginate beads. We expect that the method used in this study will inform diagnostic techniques in the field of regenerative medicine, including cell therapy.
Funding Statement
This research was supported by Basic Science Research Program through the National Research Foundation of Korea (NRF) funded by the Ministry of Education, Science and Technology (Grant No. 2012R1A1A4A01013961). The funders had no role in study design, data collection and analysis, decision to publish, or preparation of the manuscript.
References
- 1. Wikipedia (2013. Jan.) website. Available: http://en.wikipedia.org/wiki/Regenerative_medicine, 25.
- 2. Mironov V, Visconti RP, Markwald RP (2004) What is regenerative medicine? Emergence of applied stem cell and developmental biology. Expert Opin Biol Ther 4: 773-781. doi: 10.1517/14712598.4.6.773. PubMed: 15174961. [DOI] [PubMed] [Google Scholar]
- 3. Greenwood HL, Thorsteinsdottir H, Perry G, Renihan J, Singer PA et al. (2006) Regenerative medicine: new opportunities for developing countries. Int J Biotechnol 8: 60-77. [Google Scholar]
- 4. Koh CJ, Atala A (2004) Tissue engineering, stem cells, and cloning: opportunities for regenerative medicine. J Am Soc Nephrol 15: 1113-1125. doi: 10.1097/01.ASN.0000119683.59068.F0. PubMed: 15100351. [DOI] [PubMed] [Google Scholar]
- 5. Ma HL, Hung S-C, Lin S-Y, Chen Y-L, Lo W-H (2003) Chondrogenesis of human mesenchymal stem cells encapsulated in alginate beads. J Biomed Mater Rese A 64A(2): 273-281. doi: 10.1002/jbm.a.10370. PubMed: 12522814. [DOI] [PubMed] [Google Scholar]
- 6. Kim HJ, Im GI (2009) Chondrogenesis from mesenchymal stem cells. Tissue Eng Regen Med 6(14): 1343-1348. [DOI] [PMC free article] [PubMed] [Google Scholar]
- 7. Yen CN, Lin YR, Chang MD, Tien CW, Wu YC et al. (2008) Use of porous alginate sponges for substantial chondrocyte expansion and matrix production: effects of seeding density. Biotechnol Prog 24: 452-457. doi: 10.1021/bp0702828. PubMed: 18197674. [DOI] [PubMed] [Google Scholar]
- 8. Brittberg M, Lindahl A, Nilsson A, Ohlsson C, Isaksson O et al. (1994) Treatment of deep cartilage defects in the knee with autologous chondrocyte transplantation. N Engl J Med 331: 889-895. doi: 10.1056/NEJM199410063311401. PubMed: 8078550. [DOI] [PubMed] [Google Scholar]
- 9. Rudin M (2007) Imaging readouts as biomarkers or surrogate parameters for the assessment of therapeutic interventions. Eur Radiol 17: 2441-2457. doi: 10.1007/s00330-007-0619-9. PubMed: 17340100. [DOI] [PubMed] [Google Scholar]
- 10. Kim DE, Schellingerhout D, Ishii K, Shah K, Weissleder R (2004) Imaging of stem cell recruitment to ischemic infarcts in a murine model. Stroke 35: 952-957. doi: 10.1161/01.STR.0000120308.21946.5D. PubMed: 14988578. [DOI] [PubMed] [Google Scholar]
- 11. Rudin M (2009) Noninvasive structural, functional, and molecular imaging in drug development. Curr Opin Chem Biol 13: 360-371. doi: 10.1016/j.cbpa.2009.03.025. PubMed: 19447067. [DOI] [PubMed] [Google Scholar]
- 12. Nater UM, Rohleder N (2009) Salivary alpha-amylase as a non-invasive biomarker for the sympathetic nervous system: current state of research. Psychoneuroendocrinology 34: 486-496. doi: 10.1016/j.psyneuen.2009.01.014. PubMed: 19249160. [DOI] [PubMed] [Google Scholar]
- 13. Mirbahai L, Wilson M, Shaw CS, McConville C, Malcomson RD et al. (2011) H magnetic resonance spectroscopy metabolites as biomarkers for cell cycle arrest and cell death in rat glioma cells 1 Int J Biochem Cell Biol 43: 990-1001 doi: 10.1016/j.biocel.2010.07.002. PubMed: 20633697. [DOI] [PubMed]
- 14. Jackson KA, Majka SM, Wang H, Pocius J, Hartley CJ et al. (2001) Regeneration of ischemic cardiac muscle and vascular endothelium by adult stem cells. J Clin Invest 107: 1395-1402. doi: 10.1172/JCI12150. PubMed: 11390421. [DOI] [PMC free article] [PubMed] [Google Scholar]
- 15. Wang JS, Shum-Tim D, Galipeau J, Chedrawy E, Eliopoulos N et al. (2000) Marrow stromal cells for cellular cardiomyoplasty: feasibility and potential clinical advantages. J Thorac Cardiovasc Surg 120: 999-1005. doi: 10.1067/mtc.2000.110250. PubMed: 11044327. [DOI] [PubMed] [Google Scholar]
- 16. Orlic D, Kajstura J, Chimenti S, Jakoniuk I, Anderson SM et al. (2001) Bone marrow cells regenerate infarcted myocardium. Nature 410: 701-705. doi: 10.1038/35070587. PubMed: 11287958. [DOI] [PubMed] [Google Scholar]
- 17. Toma C, Pittenger MF, Cahill KS, Byrne BJ, Kessler PD (2002) Human mesenchymal stem cells differentiate to a cardiomyocyte phenotype in the adult murine heart. Circulation 105: 93-98. doi: 10.1161/hc0102.101442. PubMed: 11772882. [DOI] [PubMed] [Google Scholar]
- 18. Kocher AA, Schuster MD, Szabolcs MJ, Takuma S, Burkhoff D et al. (2001) Neovascularization of ischemic myocardium by human bone-marrow-derived angioblasts prevents cardiomyocyte apoptosis, reduces remodeling and improves cardiac function. Nat Med 7: 430-436. doi: 10.1038/86498. PubMed: 11283669. [DOI] [PubMed] [Google Scholar]
- 19. Soares DP, Law M (2009) Magnetic resonance spectroscopy of the brain: review of metabolites and clinical applications. Clin Radiol 64: 12-21. doi: 10.1016/j.crad.2008.07.002. PubMed: 19070693. [DOI] [PubMed] [Google Scholar]
- 20. Chun SI, Cho JH, Yang YI, Shin JW, Shin JW et al. (2012) Proton (1H) nuclear magnetic resonance spectroscopy to define metabolomic changes as a biomarker of adipogenic differentiation in human mesenchymal stem cells. Tissue Eng Regen Med 9: 101-108. doi: 10.1007/s13770-012-0016-6. [DOI] [Google Scholar]
- 21. Shi C, Wang X, Wu S, Zhu Y, Chung LW et al. (2008) HRMAS 1H-NMR measured changes of the metabolite profile as mesenchymal stem cells differentiate to targeted fat cells in vitro: implications for non-invasive monitoring of stem cell differentiation in vivo. J Tissue Eng Regen Med 2: 482-490. doi: 10.1002/term.120. PubMed: 18932127. [DOI] [PMC free article] [PubMed] [Google Scholar]
- 22. Lin YJ, Yen CN, Hu YC, Wu YC, Liao CJ et al. (2009) Chondrocytes culture in three-dimensional porous alginate scaffolds enhanced cell proliferation, matrix synthesis and gene expression. J Biomed Mater Res A 88: 23-33. PubMed: 18257085. [DOI] [PubMed] [Google Scholar]
- 23. Xu J, Wang W, Ludeman M, Cheng K, Hayami T et al. (2008) Chondrogenic differentiation of human mesenchyaml stem cells in three-dimensional alginate gels. Tissue Eng A 14: 667-680. doi: 10.1089/tea.2007.0272. [DOI] [PubMed] [Google Scholar]
- 24. Indrawattana N, Chen G, Tadokoro M, Shann LH, Ohgushi H et al. (2004) Growth factor combination for chondrogenic induction from human mesenchymal stem cell. Biochem Biophys Res Commun 320: 914-919. doi: 10.1016/j.bbrc.2004.06.029. PubMed: 15240135. [DOI] [PubMed] [Google Scholar]
- 25. Häuselmann HJ, Femandes RJ, Mok SS, Schmid TM, Block JA et al. (1994) Phenotypic stability of bovine articular chondrocytes after long-term culture in alginate beads. J Cell Sci 107: 17-27. PubMed: 8175906. [DOI] [PubMed] [Google Scholar]
- 26. Gagne TA, Chappell-Afonso K, Johnson JL, McPherson JM, Oldham CA et al. (2000) Enhanced proliferation and differentiation of human articular chondrocytes when seeded at low cell densities in alginate in vitro. J Orthop Res 18: 882-890. doi: 10.1002/jor.1100180606. PubMed: 11192247. [DOI] [PubMed] [Google Scholar]
- 27. Bohari SP, Hukins DW, Grover LM (2011) Effect of calcium alginate concentration on viability and proliferation of encapsulated fibroblasts Biomed Mater Eng 21: 159-170. PubMed: 22072080 [DOI] [PubMed] [Google Scholar]
- 28. Billings PC, Fiori JL, Bentwood JL, O’Connell MP, Jiao X et al. (2008) Dysregulated BMP signaling and enhanced osteogenic differentiation of connective tissue progenitor cells from patients with fibrodysplasia ossificans proggressiva (FOP). J Bone Miner Res 23: 305-313. PubMed: 17967130. [DOI] [PMC free article] [PubMed] [Google Scholar]
- 29. Lundberg P, Koskinen C, Baldock PA, Löthgren H, Stenberg A et al. (2007) Osteoclast formation is strongly reduced both in vivo and in vitro in the absence of CD47/SIRPα-interaction. Biochem Biophys Res Commun 352: 444-448. doi: 10.1016/j.bbrc.2006.11.057. PubMed: 17126807. [DOI] [PubMed] [Google Scholar]
- 30. Martínez-Bisbal MC, Martì-Bonmatì L, Piquer J, Revert A, Ferrer P, Llácer JL et al. (2004) H and 13 C HR-MAS spectroscopy of intact biopsy samples ex vivo and in vivo 1H MRS study of human high grade gliomas 1. NMR Biomed 17: 191-205. doi: 10.1002/nbm.888. PubMed: 15229932. [DOI] [PubMed] [Google Scholar]
- 31. Di Vito M, Lenti L, Knijn A, Iorio E, D'Agostino F, Molinari A et al. (2001) H NMR-visible mobile lipid domains correlate with cytoplasmic lipid bodies in apoptotic T-lymphoblastoid cells 1. Biochim Biophys Acta 1530: 47-66. doi: 10.1016/S1388-1981(00)00165-7. PubMed: 11341958. [DOI] [PubMed] [Google Scholar]
- 32. Payne GS, Leach MO (2006) Applications of magnetic resonance spectroscopy in radiotherapy treatment planning. Br J Radiol 79: S16-S26. doi: 10.1259/bjr/66348609. PubMed: 16980681. [DOI] [PubMed] [Google Scholar]
- 33. Lisignoli G, Cristino S, Piacentini A, Toneguzzi S, Grassi F et al. (2005) Cellular and molecular events during chondrogenesis of human mesenchymal stromal cells grown in a three-dimensional hyaluronan based scaffold. Biomaterials 26: 5677-5686. doi: 10.1016/j.biomaterials.2005.02.031. PubMed: 15878373. [DOI] [PubMed] [Google Scholar]
- 34. Holy CE, Shoichet MS, Davies JE (2000) Engineering three-dimensional bone tissue in vitro using biodegradable scaffolds: investigating initial cell-seeding density and culture period. J Biomed Mater Res 51: 376-382. doi: 10.1002/1097-4636(20000905)51:3. PubMed: 10880079. [DOI] [PubMed] [Google Scholar]
- 35. Halarnkar PP, Blomquist GJ (1989) Comparative aspects of propionate metabolism. Comp Biochem Physiol B 92: 227-231. PubMed: 2647392. [DOI] [PubMed] [Google Scholar]
- 36. Srere PA (1969) Citrate synthase: [.Ecologist 4: 1.3.7 Citrate oxaloacetate-lyase (CoA-acetylating)]. In: Lowenstein JM, Methods in enzymology. Volume 13 Citric acid cycle. New York: Academic Press; Inc. 3-11 p [Google Scholar]
- 37. Campbell MK, Farrell SO (2006) Biochemistry 5th edition. Thomson: Belmont; Brooks/ Cole. 579 p [Google Scholar]
- 38. Kemp GJ (1994) Interactions of mitochondrial ATP synthesis and the creatine kinase equilibrium in skeletal muscle. J Theor Biol 170: 239-246. doi: 10.1006/jtbi.1994.1184. PubMed: 7996853. [DOI] [PubMed] [Google Scholar]
- 39. Borkenhagen LF, Kennedy EP (1957) The enzymatic synthesis of cytidine diphosphate choline. J Biol Chem 227: 951-962. PubMed: 13463016. [PubMed] [Google Scholar]
- 40. Kennedy EP, Weiss SB (1956) The function of cytidine coenzymes in the biosynthesis of phospholipids. J Biol Chem 222: 193-214. PubMed: 13366993. [PubMed] [Google Scholar]
- 41. Banks J, Williams-Ashman HG (1956) Participation of cytidine coenzymes in the metabolism of choline by seminal vesicle. J Biol Chem 223: 509-521. PubMed: 13376620. [PubMed] [Google Scholar]
- 42. Yeagle PL (1989) Lipid regulation of cell membrane structure and function. FASEB J 3: 1833-1842. PubMed: 2469614. [PubMed] [Google Scholar]
- 43. Jackowski S (1996) Cell cycle regulation of membrane phospholipid metabolism. J Biol Chem 271: 20219-20222. doi: 10.1074/jbc.271.33.20219. PubMed: 8702749. [DOI] [PubMed] [Google Scholar]


