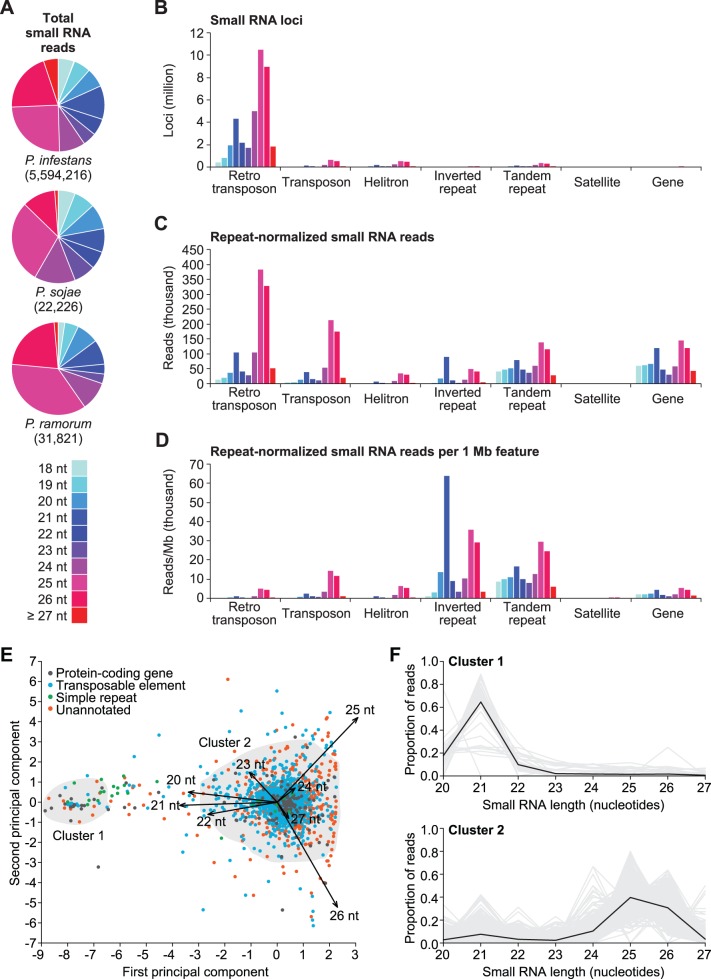
Figure 2. Classification of small RNA populations in three Phytophthora species.
(A) Distribution of small RNA reads by size in P. infestans, P. sojae and P. ramorum. (B–D) Distribution of small RNA in P. infestans at retrotransposon, transposon, helitron transposon, inverted repeat, tandem repeat, satellite repeat and gene loci. Graphs are color-coded by small RNA size based on the legend in (A). (E) Biplot of principal components 1 and 2 from the PCA of P. infestans small RNA-generating segments. Small RNA-generating segments are color-coded based on overlapping features. Segments included in Cluster 1 or Cluster 2 from DBSCAN clustering of segments based on rotated small RNA size profile data are outlined. (F) Proportion of small RNA reads corresponding to 20-27-nucleotide small RNA for each small RNA-generating segment in DBSCAN Cluster 1 (upper) or Cluster 2 (lower). Gray lines are small RNA size profiles for individual segments and black lines are the cluster average profiles.

