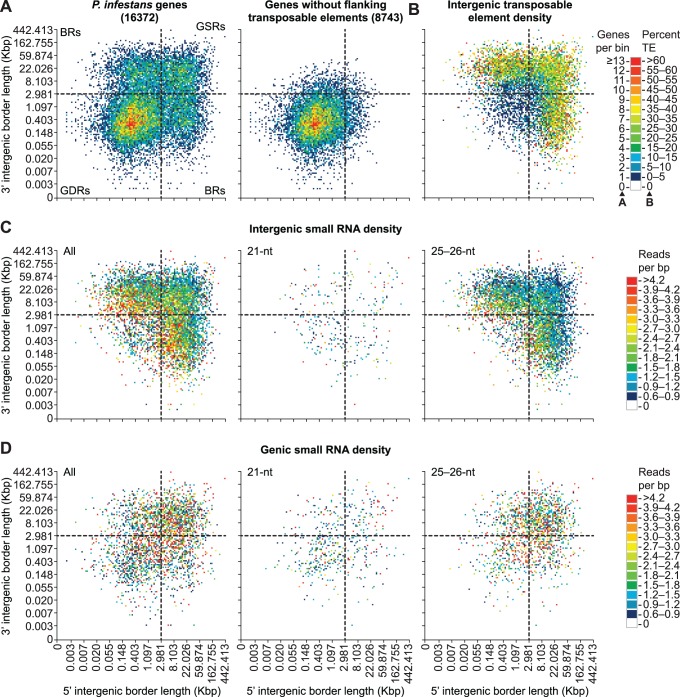
Figure 3. Distribution of small RNA in the P. infestans genome.
(A–D) Two-dimensional binning of P. infestans genes based on the length of 5′ and 3′ flanking intergenic regions. Plots are divided into quadrants with dashed lines: gene-dense regions (GDRs), gene-sparse regions (GSRs), and border regions (BRs). (A) Heatmap color scale represents the number of genes per bin for all genes (left) and genes without transposable elements in flanking intergenic regions (Data from [9]). (B) Genes were binned as in (A), but the heatmap color scale represents the percentage of base pairs in both the 5′ and 3′ flanking intergenic regions that were occupied by transposable elements. (C and D) Genes were binned as in (A), but the heatmap color scale represents the repeat-normalized small RNA reads per base pair in either both the 5′ and 3′ flanking intergenic regions (C) or the gene body (D).

