
Figure 1. Depolarisation-induced secretory response in Rab3a KO melanotrophs.
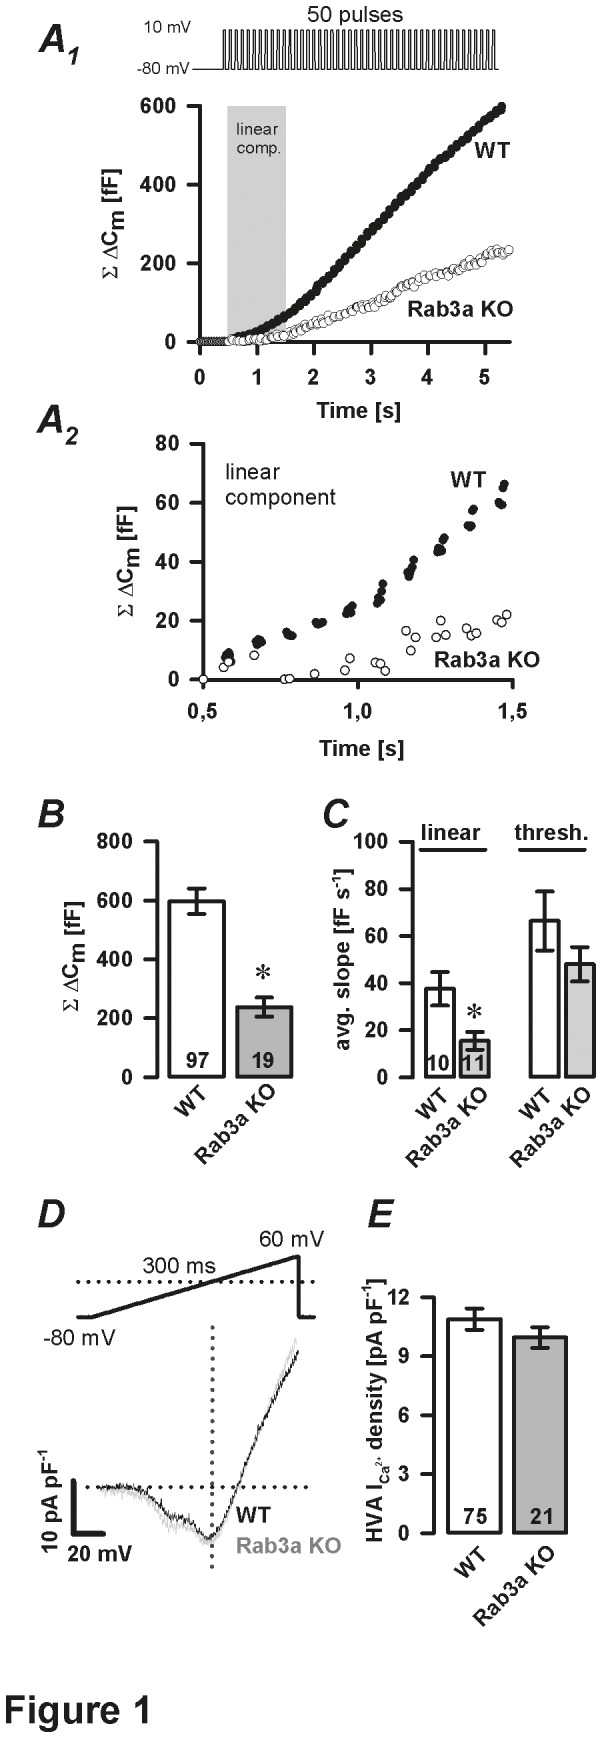
A1, Representative ΔCm traces show Ca2+-dependent exocytosis triggered by a train of 50 depolarisation pulses (40 ms duration, at 10 Hz) in WT and Rab3a KO melanotrophs. Grey area confines the linear component (first second of depolarisation-A2) from the subsequent threshold component. B, cumulative ΔCm after 50 depolarisation pulses. C, summary of average slope of the linear component (grey shaded area-panel A1) and threshold component. D, normalized I-V plot. Voltage-activated Ca2+ currents evoked by 300 ms voltage ramps (from -80 mV to 60 mV) were normalized to resting membrane cell capacitance. E, High voltage-activated (HVA) Ca2+ current density. Numbers on bars indicate the number of tested cells. ∗ P<0.05 versus WT.