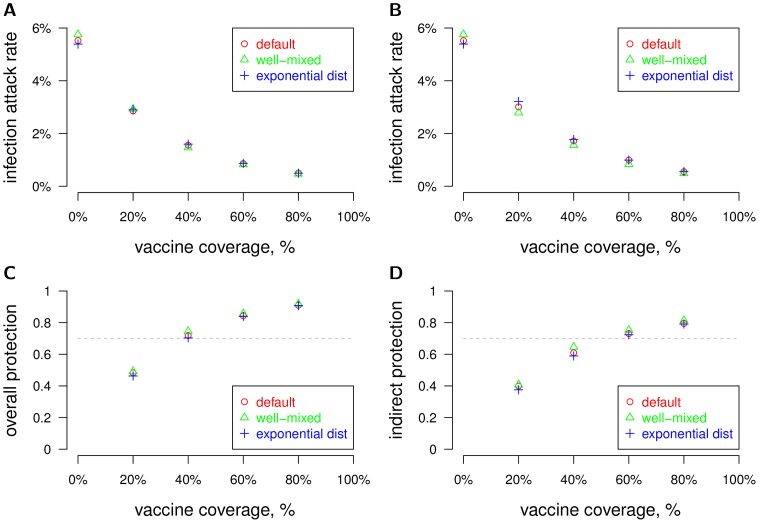
Figure 4. The effectiveness of mass vaccination under different mosquito movement and distribution assumptions.
Mass vaccination of the population was simulated under different model assumptions of mosquito movement and distribution. We plotted the attack rate vs vaccine coverage of the human population for three different model variants, as shown in Figures 1B–D. The three models were calibrated to have similar attack rates with no vaccination (0% coverage). The parameters for these three models are summarized in Table 1. The mean attack rates from 40 stochastic runs per scenario are plotted. (A) Protection by vaccine is all-or-none (the default) with 70% efficacy. (B) Protection by vaccine is leaky with 70% efficacy. (C) Overall protection vs coverage is plotted. Vaccine efficacy is 70%, as indicated by the horizontal dashed line. (D) Indirect protection vs coverage is plotted.

