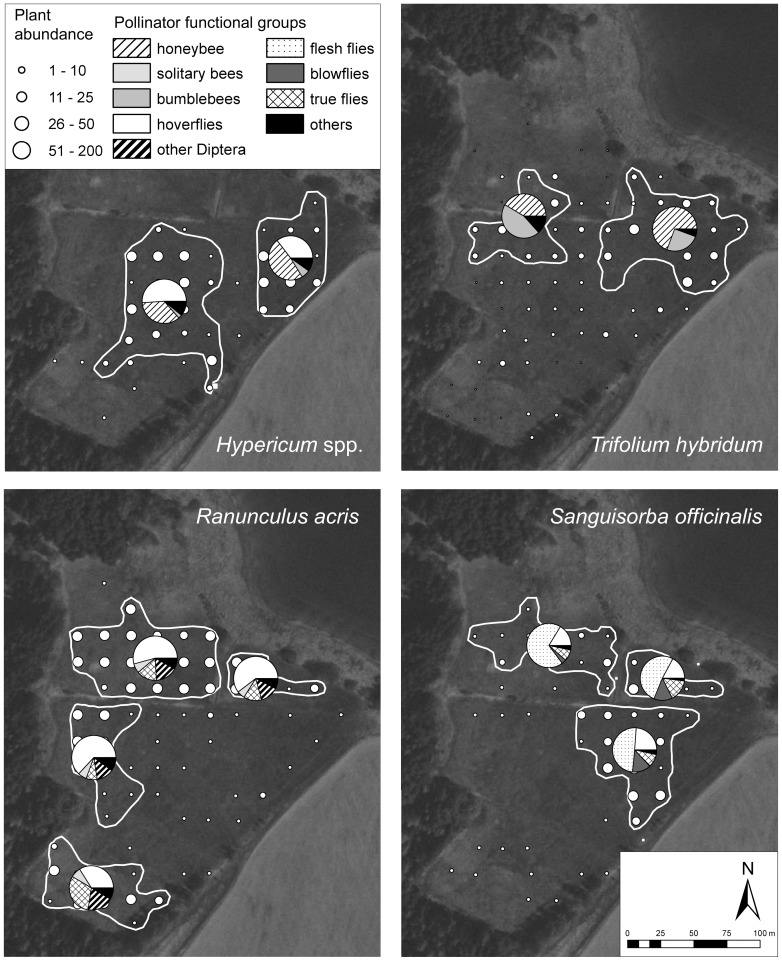
Figure 2. Maps of recorded pollinator spectra for different meadow sectors with more than 50 pollinators recorded for four of the focal plant species.
Flowering stalk abundances depicted by size of the dots; please note the different, semi-quantitative scale for Trifolium hybridum (0–64 subplots occupied). Please note that in each case the category “others” comprises different pollinator groups (see Materials and Methods for explanation). For more detailed information on pollinator abundances and spectra please refer to Figs. S3, S4. Aerial photograph credit: Czech Office for Surveying, Mapping and Cadastre.

