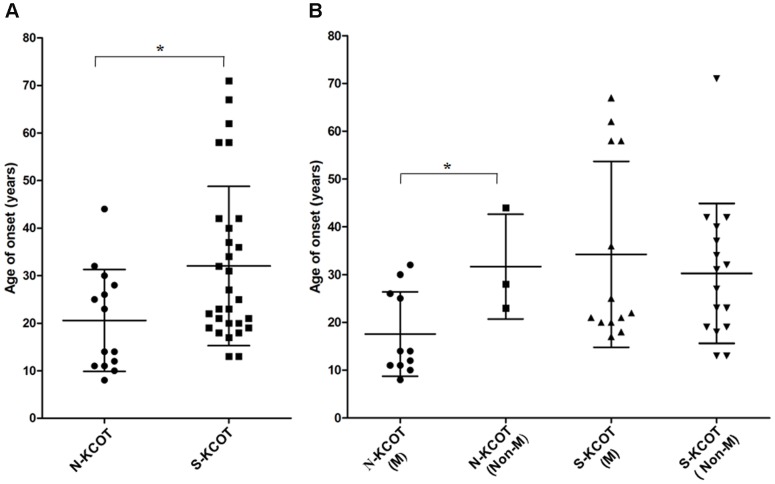
Figure 2. The onset age distribution of patients with NBCCS-associated and sporadic KCOTs.
(A) The age distribution of 14 patients with syndromic KCOTs was significantly lower than in 29 patients with sporadic KCOTs (P = 0.025). (B) In syndromic KCOTs, the age distribution in the mutation group was significantly lower than in non-mutation group (P = 0.037), whereas in sporadic KCOTs, no significant difference was detected between the groups (P = 0.537). “N-KCOT” indicates “NBCCS-associated KCOT”; “S-KCOT” indicates “sporadic KCOT”; “M” indicates “Mutation group”; and “Non-M” indicates “Non-mutation group” (Error bars±SD, * P<0.05).

