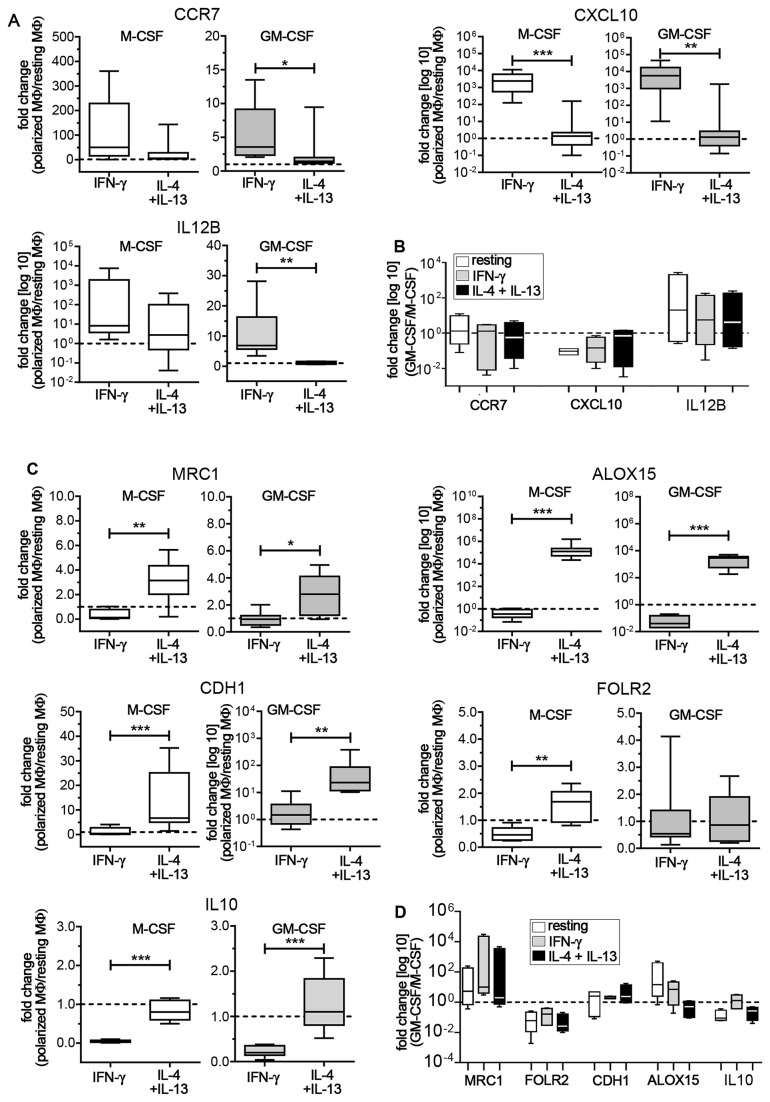
Figure 2. Expression of M1 and M2 marker genes.
In all these figures resting MΦ expression levels are indicated by the dotted line. (A) M-CSF (white box plots) and GM-CSF MΦ (grey box plots) were analyzed for mRNA expression of M1 genes. Data are expressed as fold differences of polarized MΦ relative to resting MΦ (6-8 donors). (B) Fold expression of M1 genes in GM-CSF MΦ relative to M-CSF MΦ (4 donors). White bars indicate resting MΦ, grey bars indicate IFN-γ stimulated M1 MΦ, and black bars indicate IL-4+IL13 stimulated M2 MΦ. (C) M2 gene expression in polarized MΦ relative to resting MΦ (7-8 donors). (D) Fold expression of M2 genes in GM-CSF MΦ relative M-CSF MΦ (4 donors). Bars are as described above in (B). Box plots represent the median and interquartile range; whiskers indicate the minimum and maximum, respectively. * p < 0.05, ** p < 0.01, *** p < 0.001.

