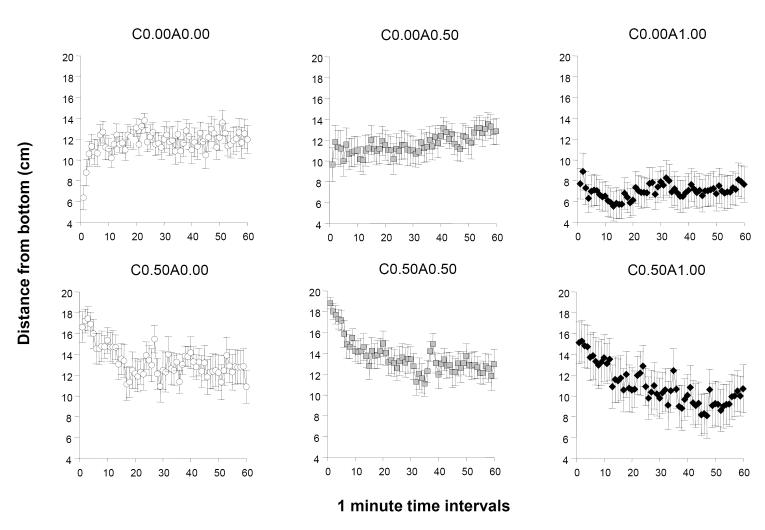
Figure 3.
The temporal trajectory of the distance from the bottom of the tank measured during a one hour long recording session is dependent upon the concentration of ethanol administered acutely during the session and on whether the fish were chronically pre-exposed to ethanol before. Mean ± S.E.M. are shown for 1-minute intervals of the recording session. The treatment conditions (group designations) are shown above the graphs. The values following the letter ‘C’ represent the concentration of ethanol (expressed as ethanol/water vol/vol %) employed during the chronic pre-treatment period (0.00 representing control and 0.50 the chronic ethanol exposed fish). The values following the letter ‘A’ represent the concentration of ethanol employed during the acute exposure, i.e. the behavioural recording, session (0.00 representing control, and 0.50 and 1.00 the corresponding acute ethanol exposed fish). Sample sizes (n) were as follows: C0.00A0.00 = 14; C0.00A0.50 = 13; C0.00A1.00 = 18; C0.50A0.00 = 13; C0.50A0.50 = 16; C0.50A1.00 = 10. Note the rapid rise of distance from bottom at the first few minutes of the recording session in the control group (C0.00A0.00) and the lack or reversal of this response in the ethanol treated groups. Also note the robust reduction of distance from bottom in the highest acute concentration group (C0.00A1.00) and the attenuation of this effect in the fish that were chronically pre-treated with ethanol and subsequently exposed to the highest ethanol dose acutely (C0.50A1.00 vs. C0.00A1.00). For details of statistical analysis and other group differences see Results.

