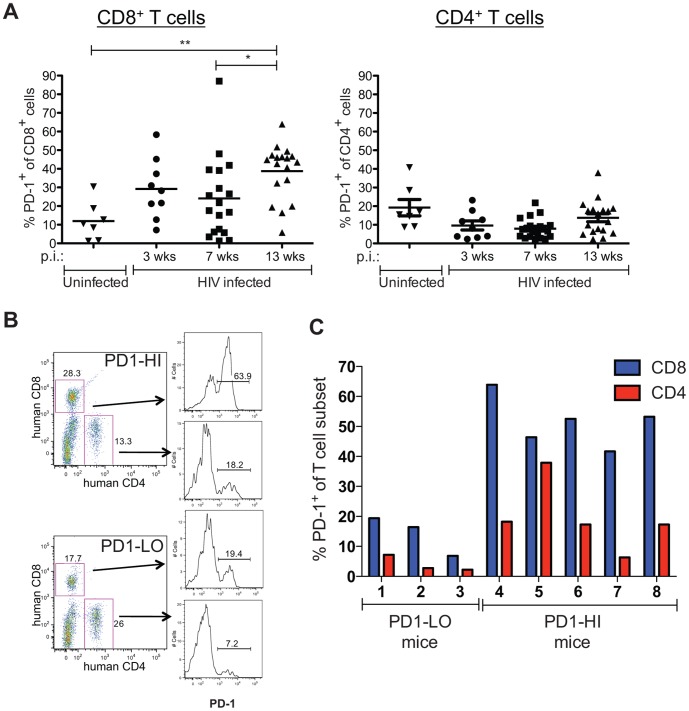
Figure 2. PD-1 expression on T cells in HIV-infected BLT mice.
Peripheral blood was obtained at various time points after HIV infection. A) Percentages of human CD8+ and CD4+ T cells expressing PD-1. Horizontal lines within data points depict mean value. Uninfected controls were from peripheral blood samples obtained at time points when littermates were infected for 9-13 weeks. (HIV infected: n = 9 mice at wk 3, n = 18 mice at other time points; Uninfected: n = 7 mice). *P = 0.01, Wilcoxon matched pairs test; **P = 0.001, Mann-Whitney test. B) Representative flow cytometry data of PD1 expression on CD8+ or CD4+ T cells at 13 weeks post infection. PD1-HI representative is mouse #4 and PD1-LO is mouse #1 depicted in the next panel. C) Percentages of CD8+ and CD4+ T cells expressing PD-1 in PD1-LO (defined as having <30% PD-1+CD8+ cells) and PD1-HI (>30% PD-1+CD8+ cells).

