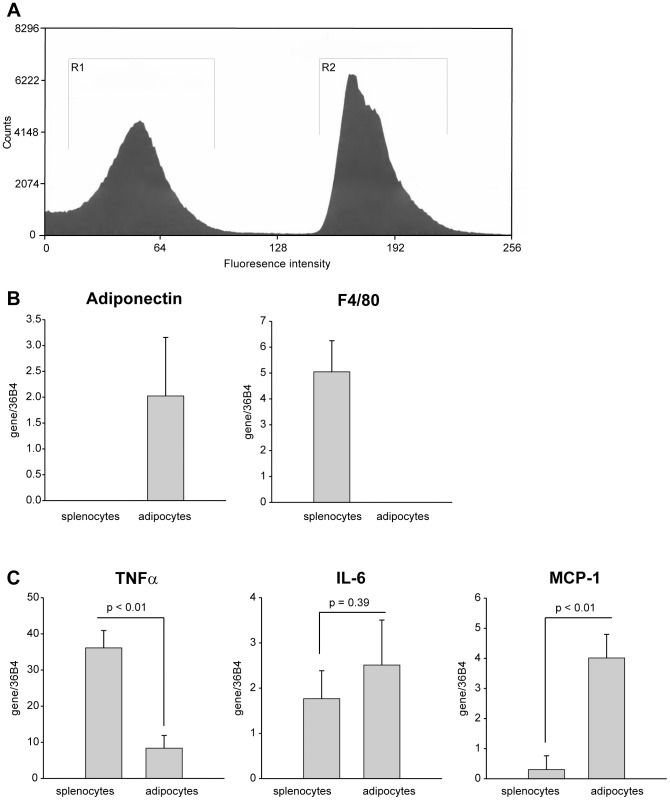
Figure 3. Splenocytes and adipocytes differentially express pro-inflammatory markers.
Differentiated 3T3-L1 adipocytes were co-cultured in direct contact with GFP-expressing murine splenocytes and activated by incubation with LPS (1 µg/mL) for 24 h. Cells were sorted for GFP-positive (splenocyte) and negative (adipocyte) cells by FACS. (A) Representative FACS is shown, with GFP-negative cells gated in R1 and GFP-positive cells gated in R2. (B) Quantitative real-time PCR (qRT-PCR) was used to measure adiponectin and F4/80 expression, specific markers for adipocytes and splenocytes, respectively, to confirm efficiency of cell sorting. (C) TNFα, IL-6 and MCP-1 mRNA expression levels were quantified by qRT-PCR in splenocytes and adipocytes following cell sorting to distinguish individual cytokine expression patterns. All qRT-PCR values were normalized to values obtained for 36B4, a ribosomal 60S subunit protein. Experimental points were measured in duplicate (B and C) for calculation of means and standard deviations. In (C), statistical significance of differing secretion levels between splenocytes and adipocytes was determined by an unpaired two-tailed Student's t-test. A significant effect was accepted when p<0.05.

