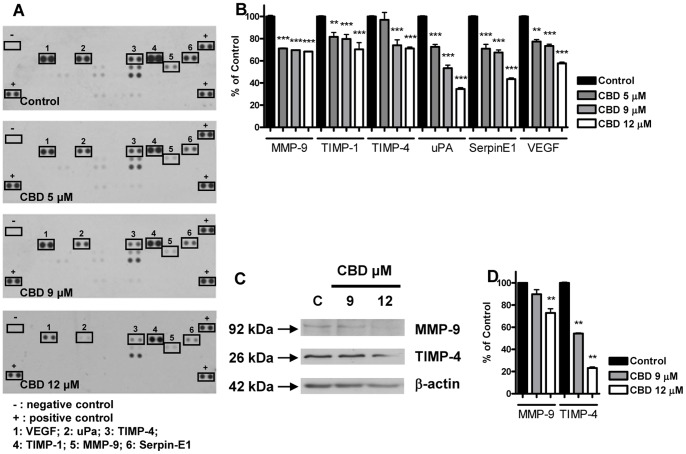
Figure 2. Effect of increasing CBD concentrations on the protein expression profile of U87-MG glioma cells.
U87-MG cells were treated with CBD for 24 h and supernatants were used to determine different protein levels through a human array kit/proteome profiler. (A) Representative proteomic membrane analysis with indication of the modified proteins. (B) Densitometric analysis of the membrane spots reported as percentage of the untreated control. Data represent the mean ± S.E.M. of three independent experiments. **p<0.01, ***p<0.001 vs Control, Dunnett’s t test. U87-MG cells were treated with CBD for 24 h and lysates from cells were used to assess MMP-9 and TIMP-4 protein levels. (C) Western blot analysis of MMP-9 and TIMP-4. A representative western blot is shown. (D) Densitometric analysis of MMP-9 and TIMP-4 signal bands from three independent experiments is reported. **p<0.01 vs Control [C], Dunnett’s t test.

