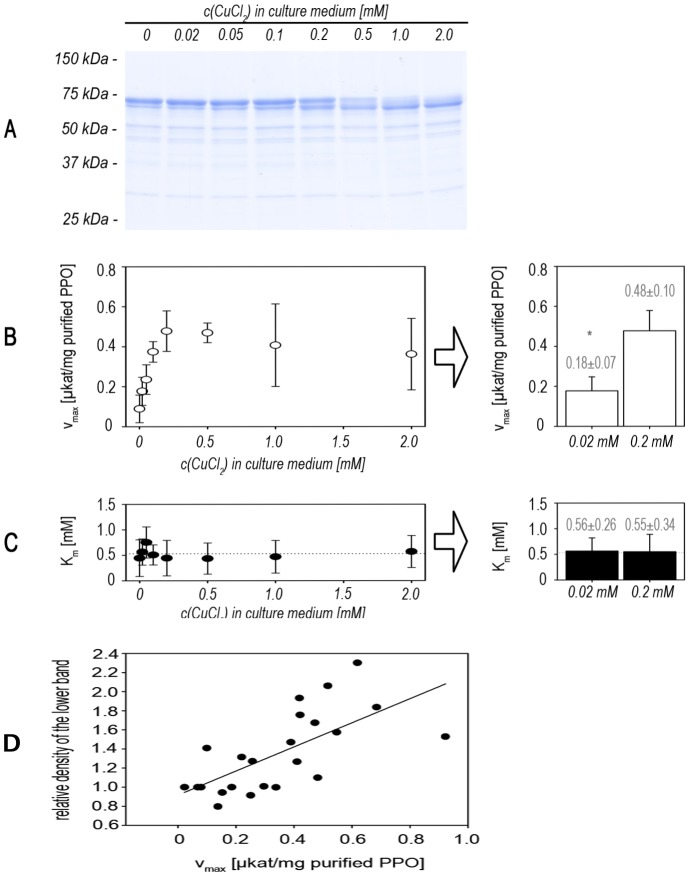
Figure 7. Influence of copper supplementation on enzymatic parameters.
Production cultures were grown with different concentrations of supplemented CuCl2 in AIM. A SDS-PAGE of purified proteins. ToPPO-2 was purified via affinity-chromatography using Strep-Tactin. Equal protein amounts were loaded on an acrylamide gel and analyzed by SDS-PAGE and Coomassie-staining. B Maximal activities (vmax) and C Michaelis constants (Km). Enzyme kinetics were performed on 4-methylcatechol as substrate and enzymatic parameters were determined by non-linear regression to the Michaelis-Menten equation. * P<0.01 in Student's t-test (n = 4); Km-values were not significantly different (P = 0.955). D Correlation between the lower band appearing on SDS-PAGE and vmax. Data given are from three independent experiments. Analysis of the relative density of protein bands was performed using ImageJ [32] calculating the lower band in relation to the respective upper one. Poor separation of double bands at higher copper concentrations (1 – 2 mM) precluded their accurate quantification so that only data from the lower concentrations (0 – 0.5 mM) are included. Statistics for correlation was performed using SigmaPlot11 and Pearson Product Moment Correlation, giving a significant positive correlation (corr. coefficient = 0.676, p<0.001, n = 23) between the tested parameters.

