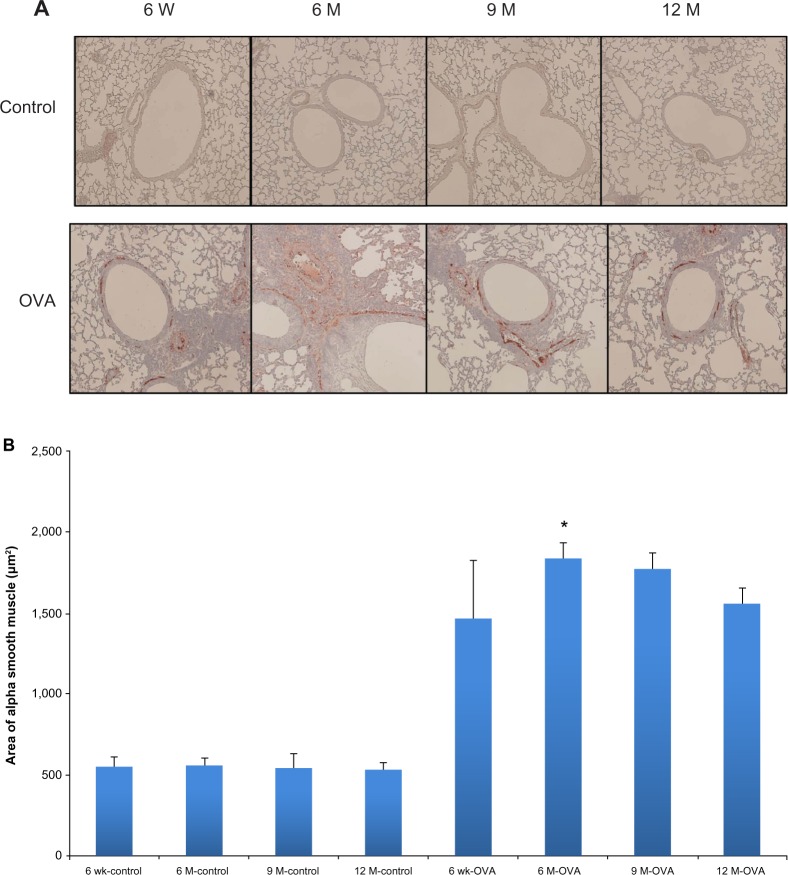
Figure 6.
Airway smooth muscle hyperplasia according to age in the acute asthma model. Representative photomicrographs of the area of smooth muscle-stained lung sections (A) (original magnification ×200) and smooth muscle areas of immunostaining per micrometer length of basement membrane of the bronchioles, as assessed using an image analyzer (B).
Notes: Values shown are mean ± SEM (n = 8–12/group); *P< 0.01, compared with the 6-week-old OVA group.
Abbreviations: W, weeks; wk, weeks; M, months; OVA, ovalbumin; SEM, standard error of the mean.

