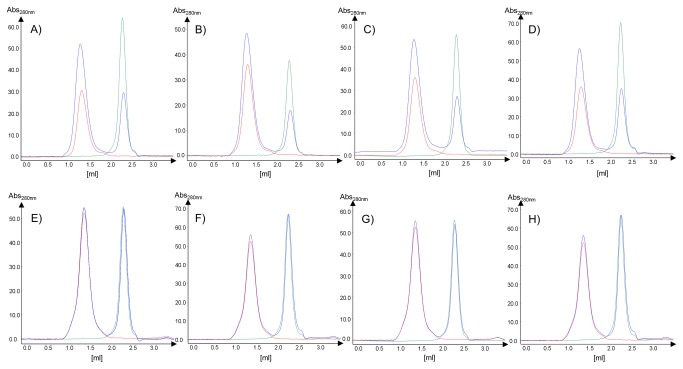
Figure 3. Binding of nanobodies to the T1 and T2 channels monitored via analytical gel filtration.
Panels A-D represent elution profiles for the binding analysis of selected nanobodies against the T2 channel, while panels E-F display the same experiments but using the T1 channel as control (A, E: nanobody 15; B, F: nanobody 17; C, G: nanobody 19; D, H: nanobody 21). AGF profiles are shown for the nanobody only in green, for the T2/T1 channel only in red and the complex in blue.

