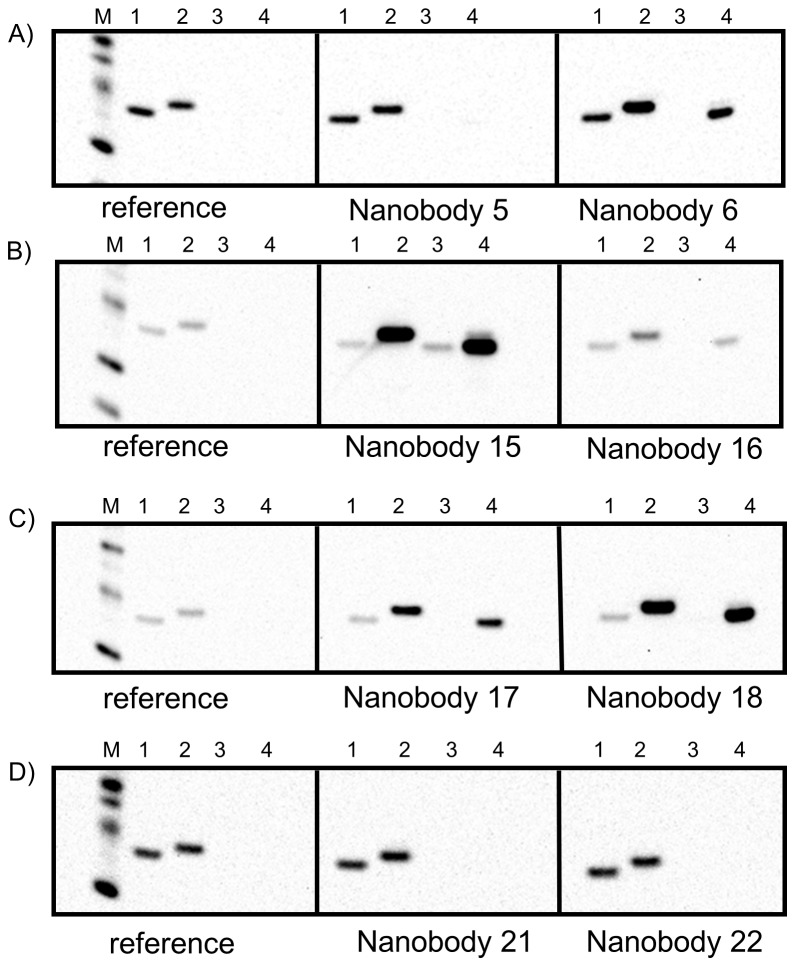
Figure 4. Western Blot analysis for affinity ranking of selected binders.
Panels A-D show 4 Western blot examples using various nanobodies as stated. Each strip contains the same 4 samples: (1) His-tagged T1-channel (0.1 μg), (2) His-tagged T2-channel (0.1 μg), (3) tag free T2-channel at low concentration (0.01 μg), (4) tag free T2-channel at higher concentration (0.1 μg). The His-tagged molecular weight marker is shown on the reference strip. The western blot intensity ratios between lane two of the sample and reference strips allows a first ranking of binders according to their affinities.

