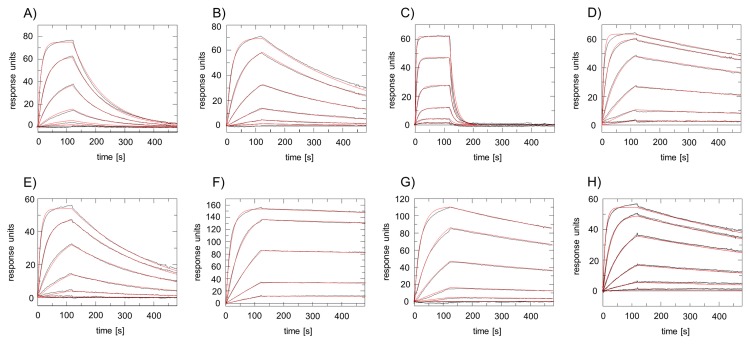
Figure 5. Surface plasmon resonance analyses of the T2 channel with various nanobodies.
Different concentrations of purified nanobodies (0.35 - 86.1 nM) were injected across a surface coated with the T2 channel. Sensorgrams with blank buffer injections were subtracted. Panels A-H represent sensorgrams for nanobodies 3, 4, 7, 8, 10, 15, 18 and 23, respectively. Resulting on- and off-rates and dissociation constants are summarized in Table 1. Experimental curves are plotted in black; red lines denote the corresponding 1:1 interaction model fit to the experimental data.

