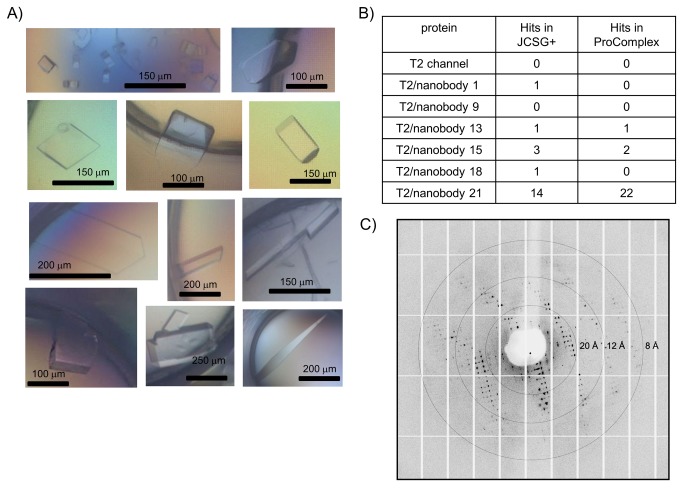
Figure 8. Crystallization of T2/nanobody complexes.
(A) Examples of initial crystallization hits for different T2/nanobody complexes obtained in various conditions of the JCSG+ and ProComplex screens. The scale bar for size estimations of the crystal is shown. (B) Table with initial crystallization hits obtained for the different T2/nanobody complexes in the two commercially available crystallization screens JCSG+ and ProComplex. (D) Diffraction image from one of the crystals obtained from the initial crystal screening (T2/nanobody 21 complex) diffracting to 8 Å resolution.

