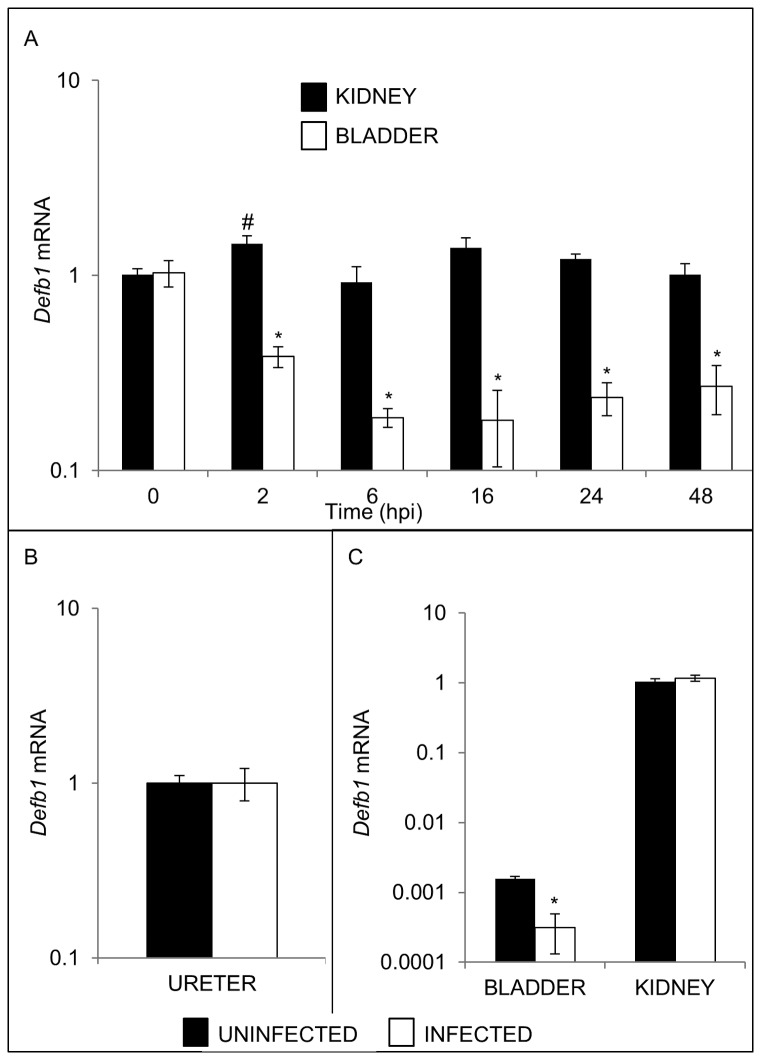
Figure 3. Effect of UPEC infection on Defb1 mRNA expression.
(A) Timecourse of Defb1 mRNA expression in bladders (open boxes) versus kidneys (shaded boxes) of UPEC infected mice. Time in hpi is indicated on the X axis. Samples were normalized for Gapdh mRNA expression and compared to a pool of uninfected bladder or kidney cDNA using the 2^-ΔΔCT method[22]. Means ± S.E.M. are shown (n=4 bladders and 4 kidneys/group) * p < 0.05, student’s t-test, indicated timepoint versus uninfected bladders; # p < 0.05, student’s t-test, indicated timepoint versus uninfected kidneys. (B) Defb1 mRNA was measured in ureters from uninfected C57BL/6 females (shaded box) and 16 hpi with UTI89 (open box). Samples were normalized for Gapdh content and expressed as fold-difference compared to a pool of uninfected mouse ureter cDNA using the 2^-ΔΔCT method. There was no significant difference in Defb1 expression between groups. (C) Bladder Defb1 mRNA expression is down-regulated in C3H/HeN mice 16 hpi, but kidney Defb1 mRNA levels are unchanged. Shaded boxes represent uninfected organs, and open boxes represent organs harvested 16 hpi. Samples were normalized for Gapdh mRNA expression and compared to a pool of uninfected kidney cDNA using the 2^-ΔΔCT method[22]. Means ± S.E.M. are shown (n=3 bladders and 3 kidneys/group) * p < 0.05, student’s t-test, naïve versus infected C3H/HeN bladders.

