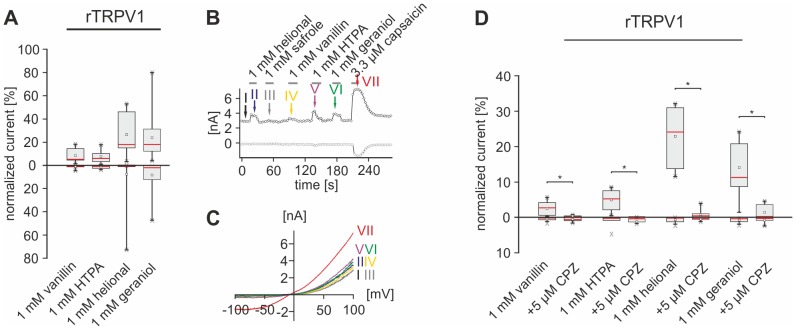
Figure 5. Odorants activate functionally expressed rTRPV1.
A: Box plot diagram depicting normalized rTRPV1-mediated currents evoked by vanillin (n = 10), HTPA (n = 17), helional (n = 17), and geraniol (n = 17) during VC recordings. Outward currents recorded at +100 mV are depicted as upward facing bars, inward currents recorded at −100 mV are depicted as downward facing bars. Detailed values can be derived from table 5. B: Whole-cell VC recordings of CHO cells functionally expressing rTRPV1, challenged with vanillin, HTPA, helional, geraniol and cap. Amplitudes of currents at +100 (black) and −100 mV (gray) are plotted vs. time. Colored arrows and roman numerals assign to individual voltage ramps shown as current traces in the IV-plots depicted in C. Stimulus applications are indicated by gray bars. D: Box plot diagram depicting normalized rTRPV1-mediated currents triggered by vanillin (n = 11), HTPA (n = 9), helional (n = 10), and geraniol (n = 10) that are inhibited by CPZ (exemplary recordings are depicted in fig. S3A). Outward currents recorded at +100 mV are depicted as upward facing bars, inward currents recorded at −100 mV are depicted as downward facing bars. Detailed values can be derived from table 6.

