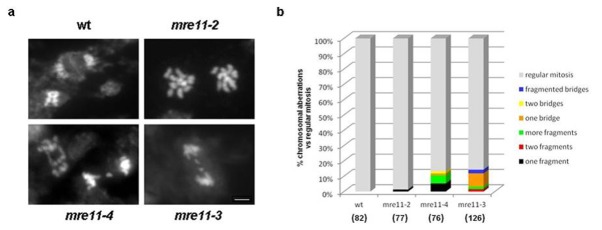
Figure 3. Genome instability in mitotic cells from mre11 mutants.

Anaphase spreads were prepared from pistils stained with 4’,6-diamidino-2-phenylindole (DAPI) and visualized by epifluorescence microscopy. a) Wild-type figure (upper left) show the phragmoplast, the cytoplasmic structure that forms at the equator of the spindle after the chromosomes have divided during the anaphase of plant mitosis. Genome instability manifested by chromosome fusions and chromosomal breaks is evident in mre11-4 and mre11-3 cells. Examples of mre11-4 anaphase with two bridges and acentric fragment lagging between separating daughter nuclei are shown. Thick fragmented bridge was detected in mre11-3 cell. Scale bar indicates 2 μm and serves all micrographs. b) Graphic representation recapitulating the spectrum of cytological abnormalities in mitotic cells from wild-type and mre11 flower buds. Chromosomal aberrations in cells are classified in three categories; anaphase bridges, acentric fragments and fragmented bridges. The total number of scored mitotic cells for each genotype is indicated in parentheses.
