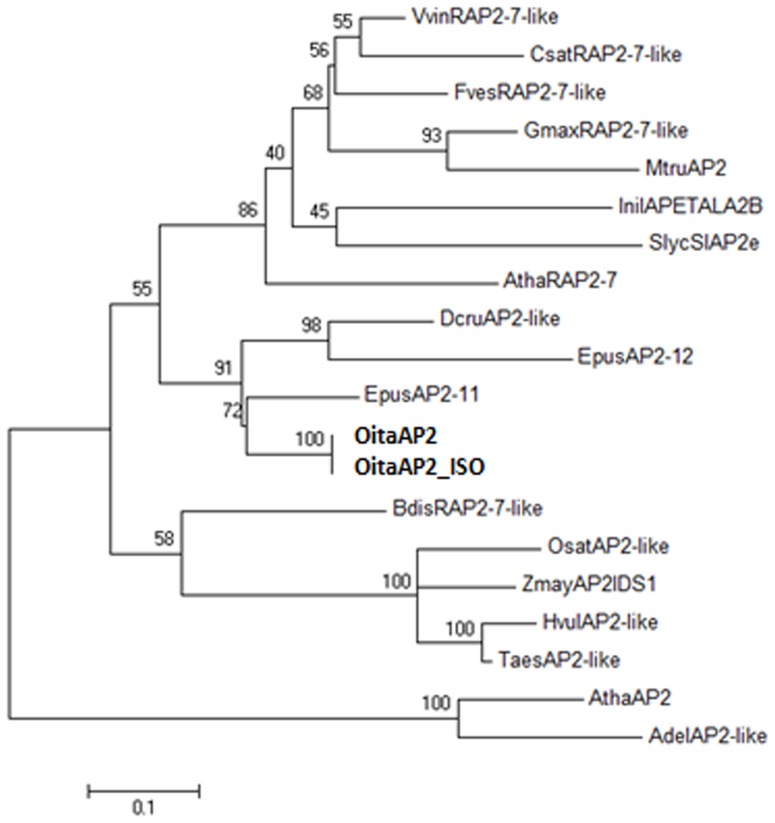
Figure 2. Maximum likelihood tree constructed on the alignment of the AP2-like amino acid sequences belonging to both AP2 and RAP2 groups.
Numbers indicate the bootstrap percentages (on 1000 replicates). The abbreviations used (those obtained in the present study are in bold) are in agreement with the GenBank definitions. Actinidia deliciosa AdelAP2-like (AER60526); Arabidopsis thaliana AthaRAP2-7 and AthaAP2 (NP_001189625 and NP_195410, respectively); Brachypodium distachyon BdisRAP2-7-like (XP_003569031); Cucumis sativus CsatRAP2-7-like (XP_004148250); Dendrobium crumenatum DcruAP2-like (AAZ95247); Erycina pusilla EpAP2-11 and EpAP2-12 (AGI62047 and AGI62048, respectively); Fragaria vesca FvesRAP2-7-like (XP_004295997); Glycine max GmaxRAP2-7-like (XP_003542008); Hordeum vulgare HvulAP2-like (AAL50205); Ipomea nil InilAPETALA2B (BAD36744); Medicago truncatula MtruAP2 (XP_003606515); Orchis italica OitaAP2 and OitaAP2_ISO (KF152921 and KF152922, respectively); Oryza sativa OsatAP2-like (AAO65862); Solanum lycopersicum SlycSlAP2e (NP_001233891); Triticum aestivum TaesAP2-like (AAU88192); Vitis vinifera VvinRAP2-7-like (XP_002284749); Zea mays ZmayAP2IDS1 (NP_001104904).

