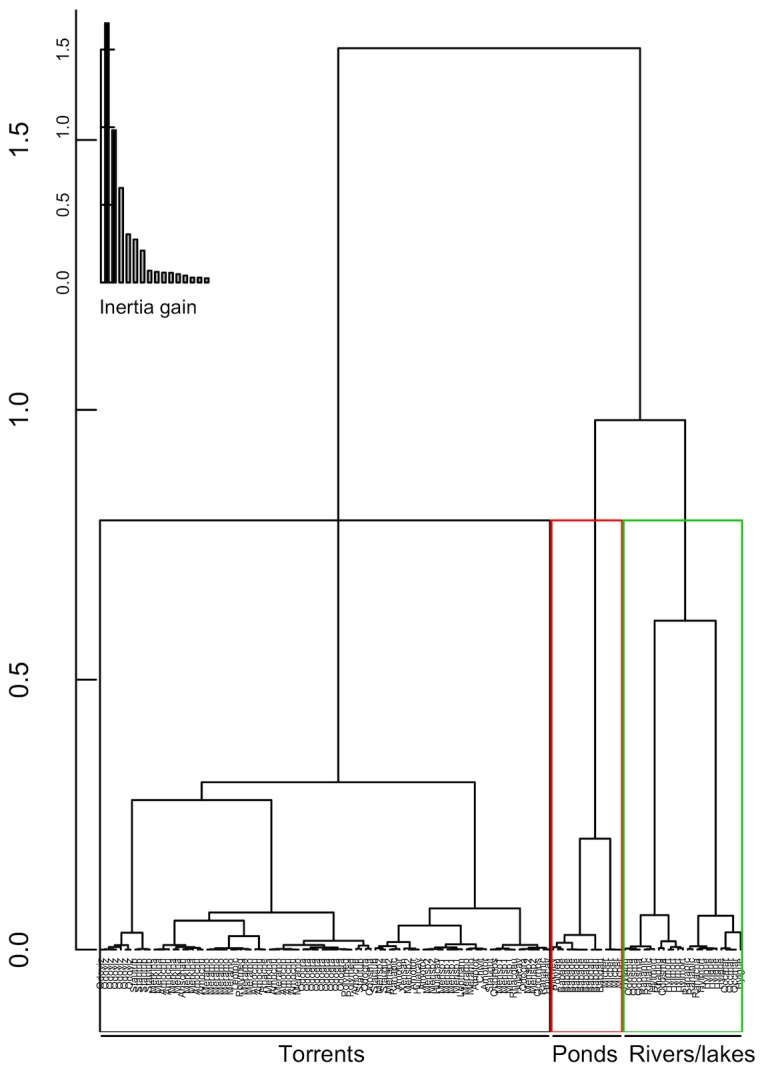
Figure 2. Dendrogram of the individual male frogs resulting from the hierarchical cluster analysis based on their microhabitats.

The coloured rectangles correspond to the cluster attribution: black cluster = ‘torrents’, red cluster = ‘ponds’, green cluster = ‘rivers’. Inertia gain for additional dimensions is inset in the top left corner.
