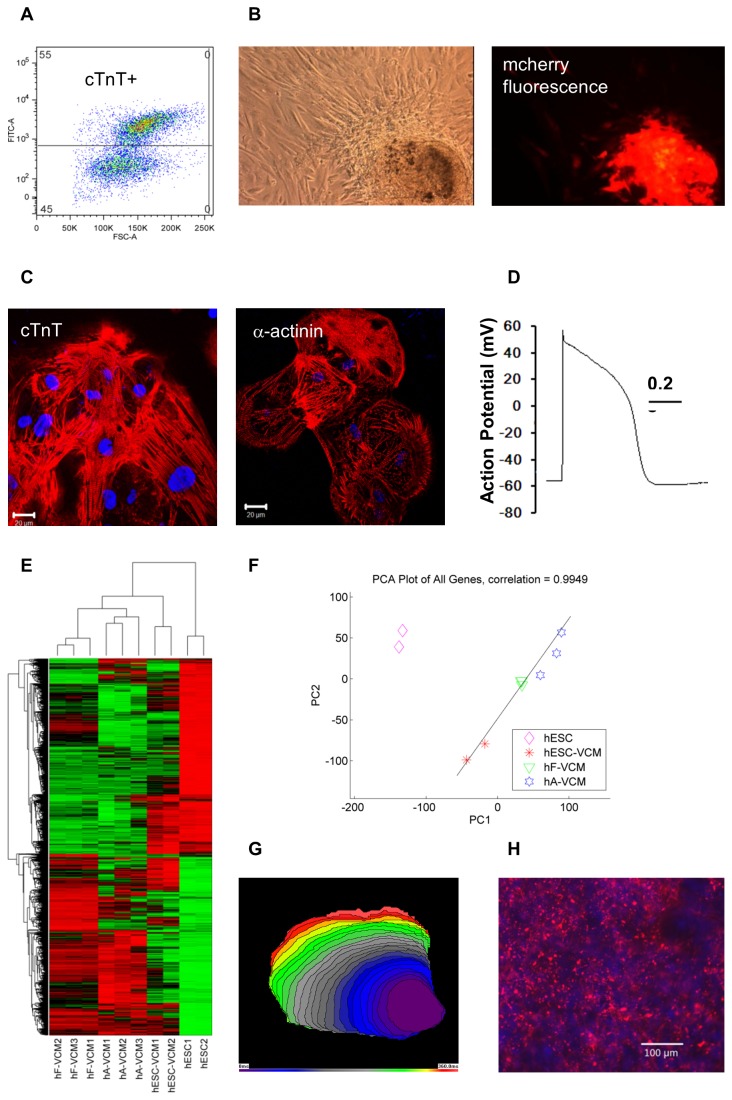
Figure 1. Developmental classification of hESC-VCMs.
A) A representative FACS plot showing that approximately 55% of hESC-derivatives were positive for cardiac troponin-T (cTnT) prior to selection. B) Selected MLC2V-mCherry+ hESC-VCMs (~95% purified) under brightfield and fluorescence microscopy (100x). C) Purified HESC-VCMs were stained with anti-cTnT and anti-α-actinin antibodies. D) Representative action potential of hESC-VCMs. E) Hierarchical clustering showing that biological replicates cluster together. Red and green indicates up- and down-regulation respectively. F) Principal Component Analysis. HESC-VCMs, hF-VCMs and hA-VCMs lie along a linear developmental axis (dotted black line). Correlation coefficient is shown to indicate the degree of linearity. G) An activation isochronal map of trans-membrane potential with 15ms intervals. H) CX43 staining of hESC-VCMs. Red= CX43 staining, blue=DAPI.

