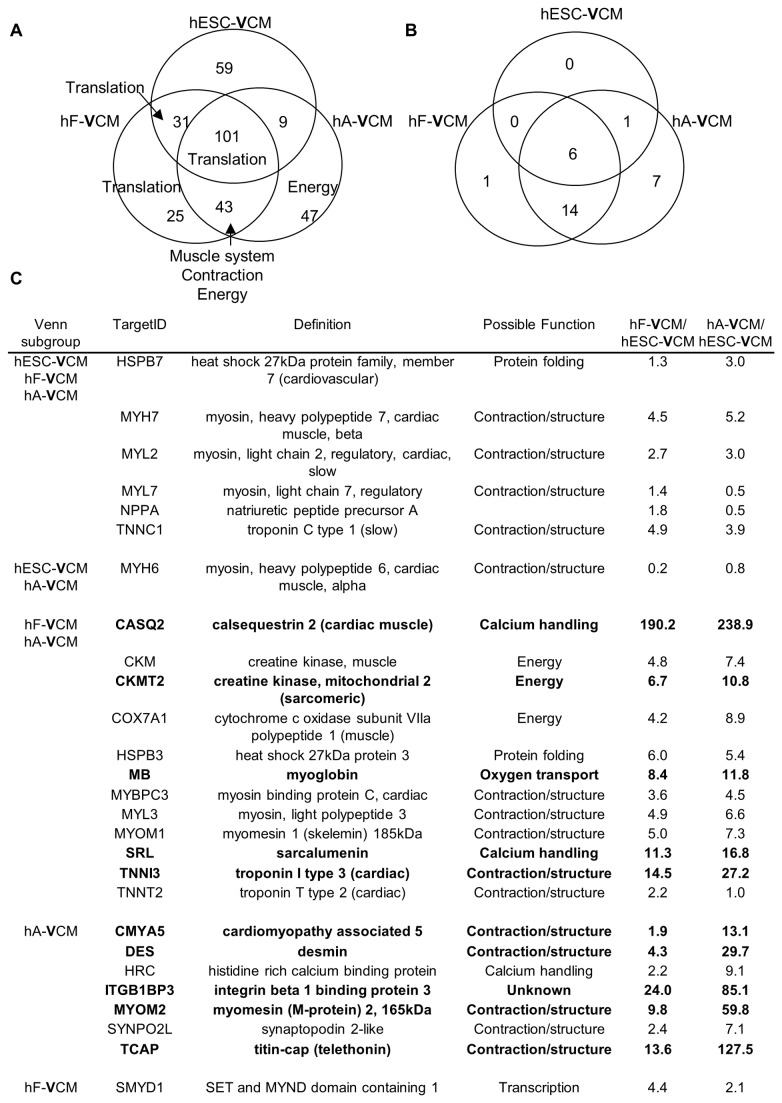
Figure 2. The most abundant transcripts in VCM populations.
A) The Venn diagram shows the distribution of the top 200 most abundant genes in hESC-VCMs, hF-VCMs and hA-VCMs. The number of genes in common is indicated. The labels refer to biological processes that are enriched. B) The tissue-specific distribution of the top 200 genes was examined in public databases including Genenote and bioGPS. The ‘cardiac-specific’ genes among the top 200 most abundant genes are shown. C) 27 cardiac-specific genes within the top 200 most abundant genes in hESC-VCMs, hF-VCMs and/or hA-VCMs. Fold change relative to hESC-VCMs are indicated and fold change >10 is highlighted in bold. Possible function is based on gene ontology association.

