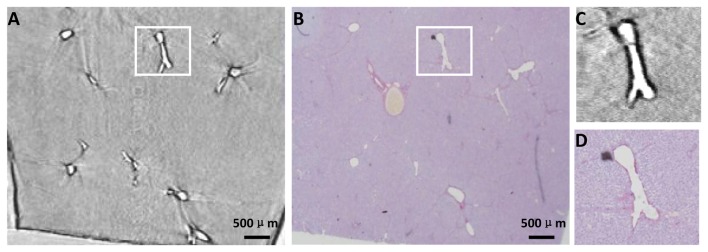
Figure 3. CT image and histological section of the same specimen as in Figure 2.

(A) One slice of DEI-CT reconstruction images. (B) Histological section that corresponds to the area where the CT image is acquired. The two images in (C) and (D) are the enlarged images of the white rectangle regions in (A) and (B), respectively.
