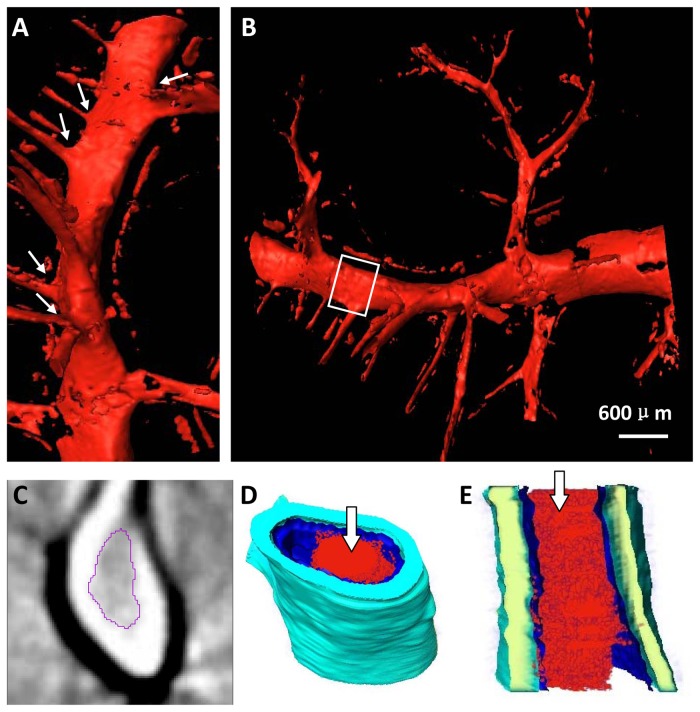
Figure 6. The two profiles of the 3D reconstruction are shown in (A) and (B).
Obvious distortion deformation is presented in (A), and the vessel branch angles, as indicated by the arrows, appear stiffer. (C) One CT slice and (D) the vessel segment, shown in the white rectangle region in (B), are presented. The thrombus inside the vessel in (C) is segmented. (E) Longitudinal section of the vessel segment in (D). The inner red part indicated by the arrows in (D) and (E) is a thrombus.

