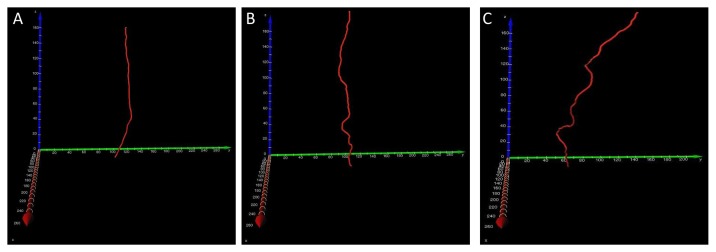
Figure 7. The 3D centerline images from the main stems of the vessels shown in Figures 4A, 5A and 6A.

The 3D centerlines at different degrees of fibrosis can be rotated in real time to facilitate a clear visualization of the vessel distortion deformation. See Video S3, S4 and S5, respectively.
