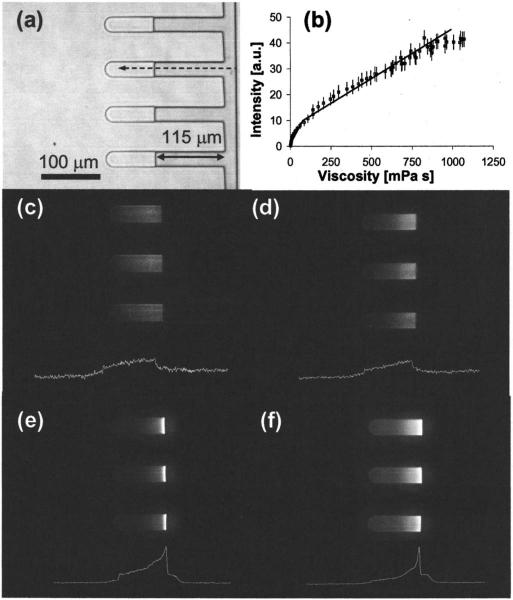
FIG. 3.
(a) 200× phase image of microchannels loaded with glycerol, (b) calibration curve for CCVJ, 200× fluorescence image of the microchannels with (c) glycerol solution (texposure=1000 ms), (d) fructose solution (texposure=55 ms), (e) sucrose solution (texposure=55 ms), and (f) trehalose solution (texposure=1000 ms).

