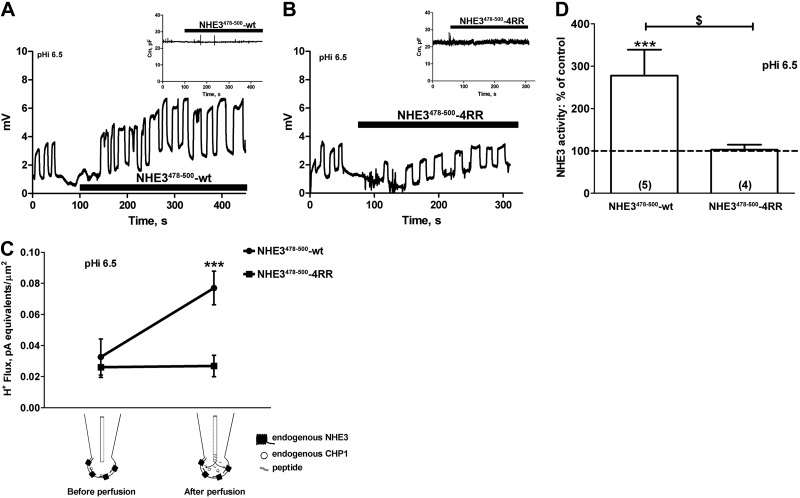
Figure 3.
Effect of NHE3478–500-WT peptide perfusion on NHE3 transport and Cm. A, B) Example of a recording set for NHE3 transport in a single OK cell before and after perfusion with the NHE3478–500-WT peptide (A) and its mutant, NHE3478–500-4RR (B). pHi was maintained at 6.5, and extracellular pH, extracellular Na+, and intracellular Na+ were as described in Fig. 2. Each oscillation represents the recording of NHE3 activity and resulted from the movement of the pH microelectrode close to (higher microvolts) and away from (lower microvolts) the plasma membrane of a single cell. Traces show a momentary stop in the recording of oscillation measurements immediately before and after perfusion of the peptides. Inset: effect on Cm (pF) of the perfusion of the NHE3478–500-WT or NHE3478–500-4RR peptides. C, D) Summary of the data expressed as H+ flux (C) and a percentage of the control (D). Cells were held in whole-cell configuration, and the peptide NHE3478–500-WT or NHE3478–500-4RR was perfused via a pipette line. Solid circles or squares: average data from individual experiments; bars and error bars: means ± se. Numbers in parentheses: experiments performed in identical conditions. ***P < 0.001 vs. control; ANOVA. $P < 0.05; ANOVA.

