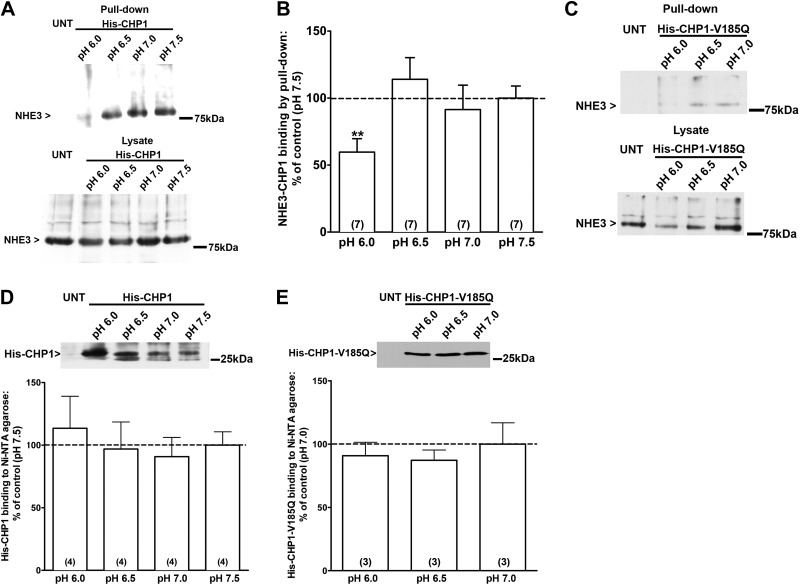
Figure 5.
pH dependence of CHP1-NHE3 binding. A) NHE3 total protein binding to CHP1 at increasing pH quantified by pull-down assay using the 3H3 anti-NHE3 antibody in untransfected (UNT) and His-CHP1-transfected cells, along with NHE3 total lysate in the same condition. B) Results are expressed as a percentage of NHE3-CHP1 binding at different pH vs. pH 7.5. C) Control pull-down of NHE3 total protein by His-CHP1-V185Q and total NHE3 lysate in the same conditions. D) His-CHP1 expression. Results are expressed as a percentage of His-CHP1 binding to Ni-NTA agarose at different pH vs. pH 7.5. E) His-CHP1-V185Q expression. Results are expressed as a percentage of His-CHP1 binding to Ni-NTA agarose at different pH vs. pH 7.0. Bars and error bars: mean ± se. Numbers in parentheses: experiments performed in identical conditions. **P < 0.01 vs. control; ANOVA.

