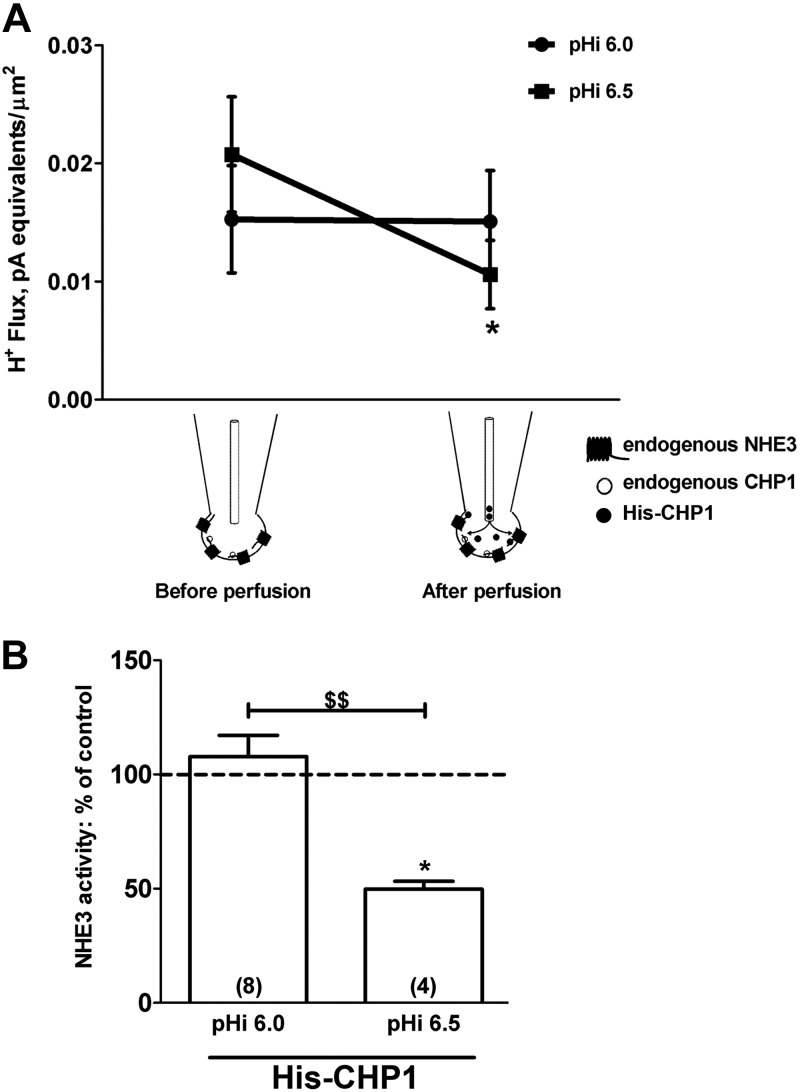
Figure 6.
pH-dependent effect of CHP1 perfusion on NHE3 transport. A) Effect of His-CHP1 perfusion on NHE3 H+ flux at pHi 6.0 and 6.5. Cells were held in a whole-cell configuration, and His-CHP1 was perfused via a patch pipette line. B) Results are presented as a percentage of control NHE3 activity. Data before perfusion of His-CHP1 were normalized to data after perfusion at the indicated pHi. Bars and error bars: mean ± se. Numbers in parentheses: experiments performed in identical conditions. *P < 0.05 vs. control; ANOVA. $$P < 0.01; ANOVA.

