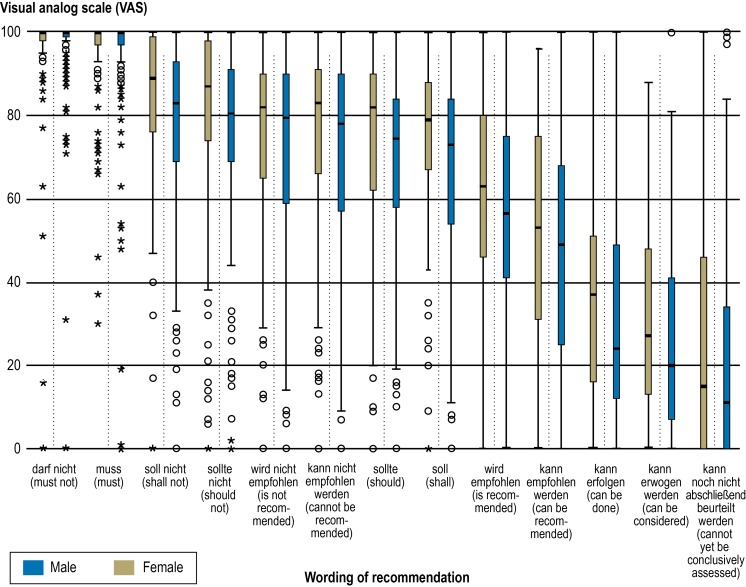
Figure.
Box plot: perceived level of obligation (VAS values: 0–100) conveyed by guideline recommendations, according to sex of respondent
° = outlier (value that is 1.5 to 3 times the interquartile range from the median)
* = extreme (value that is more than 3 times the interquartile range from the median)
VAS = perceived level of obligation conveyed by recommendation wording as estimated on a visual analog scale

